I am guest blogging for the INFORMS Conference in Nashville. See my first post on the new INFORMS logo and website.
Thoughts on the world of operations research
I am guest blogging for the INFORMS Conference in Nashville. See my first post on the new INFORMS logo and website.
Now that I have moved (at least partially!) into academic administration, my colleagues ask for advice on publishing strategy. A situation has occurred with one of my colleagues that has made me question my understanding of precedence of research results. I’d love some feedback to help me understand what went wrong here.
My colleague, call him R1, proved a couple theorems in a fast-moving subfield of optimization. He wrote up the results and on March 1 submitted the paper to The Slow but Prestigious Journal of Optimization, which I will call SJ (the characters get confusing, so the inset Cast of Characters may help). He also posted the paper on the well-known eprint servers Optimization Online and ArXiv (OO/A). The paper began its slow and arduous thorough refereeing at SJ.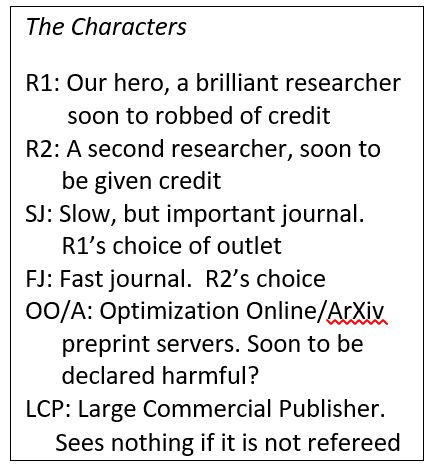
On August 1, R1 received a perky email from researcher R2 with a paper attached saying “Thought you might be interested!”. The paper contains a subset of R1’s results with no reference to R1’s work. This is not a preprint however, but an “article in advance” for a paper published in Quick and Fast Journal of Optimization, QJ. QJ is a journal known for its fast turn-around time. The submission date of R2’s work to QJ is March 15 (i.e. two weeks after R1 posted on OO/A and submitted to SJ).
R1 lets R2 know of his paper, pointing to OO/A. R1 never hears anything more from R2.
R1 contacts the editors of QJ suggesting some effort be made to correct the literature with regard to the precedence of this work. QJ declines to change R2’s paper since it has already been published, and the large commercial publisher (LCP) does not allow changes to published articles (and, besides, R2 won’t agree to it).
OK, what about publishing a precedence acknowledgement in the form of a letter to the editor? I find this somewhat less than satisfying since the letter to the editor is separate from the paper and no one reads journals as “issues” anymore. But at least QJ would be attempting to correct this mess. And here is where I get both confused and outraged. The editor’s response is:
Also, during consultations with [LCP]’s office, it became clear that LCP does not approve of publishing a precedence acknowledgement towards a paper in public domain (preprint server). I hope you would agree that the fact that a paper is posted on a preprint server does not guarantee its content is valuable or even correct – such (partial) assurances can be obtained only during peer-review process.
Hold on, what? QJ and LCP are saying that they will ignore anything that is not in a peer-reviewed journal! R2 does not have to say anything about R1’s result since it has not been refereed. Further, unless R1 gets the paper published in SJ with the March 1 submission date, QJ will not publish a precedence acknowledgement. If the paper gets rejected by SJ and my colleague then publishes in Second Tier Journal on Optimization, clearly the submission date there will be after QJs date so R2 takes precedence. If the paper doesn’t get published, then R2 and QJ will simply act as if R1 and OO/A do not exist.
I find this situation outrageous. I thought the point of things like OO/A are to let people know of known results before journals like SJ finish their considered process of stamping their imprimatur on papers. If the results are wrong, then following authors at least have to point out the flaws sometime during the process.
Now I don’t know if R2 saw R1’s paper at OO/A. But if he did, the R1’s posting at OO/A at least warned him that he better get his paper submitted. Of course, R1’s paper might have helped R2 get over some roadblocks in R2’s proof or otherwise aid him in finishing (or even starting, though there are no overt signs of plagiarism) his paper. But it seems clear there was absolutely no advantage for R1 to post on OO/A, and clear disadvantages to doing so. R1 would have been much better served to keep his results hidden until acceptance at SJ or elsewhere.
This all seems wrong. R1 put out the result to the public first. How did R1 lose out on precedence here? What advice should I be giving colleagues about this? Here is what I seemed to have learned:
This all seems perverse. How should I think about this? Has anyone faced something similar? Does anyone see a satisfactory resolution to this situation? And, for those on editorial boards, does your journal have policies similar or different than that of LCP? Is this ever discussed within journal boards? Is all this a well-known risk?
Now that my son has turned twelve, I am beginning to see among his friends a bifurcation: some “love” mathematics and some “hate” mathematics. This is frustrating to me since I know that if the kids see operations research then they will all love it. What is not to like? Coloring maps, finding paths, scheduling sports leagues…. who could ask for more? But if they hate mathematics now, it will be very hard to get them into operations research in the future.
My son has generally had good mathematics teachers, and his curriculum is full of interesting aspects of mathematics. Sometimes the variety drives me crazy (seriously: shouldn’t a twelve year old know what 9×7 is without hemming and hawing?) but most of the time I like what he is learning. Rather than rote memorization, the teachers are trying to imbue him with an understanding of concepts such as measurement, algebraic thinking, counting, geometry and so on. I do think such an approach to mathematics will lead to a greater appreciation for things like operations research when the time comes. And I wish that time was no later than high school (see HSOR for some older but still very useful modules for that level).
I have a colleague in New Zealand who is trying to provide rich mathematical-oriented resources for a variety of levels. Nicola Petty (“Dr. Nic”) runs the Statistics Learning Center which has, among many other things, a number of very useful videos on many statistical concepts. I often send my students there when it appears my own explanations of those concepts is not meshing with them.
 Dr. Nic has a Kickstarter going on for a set of mathematics cards aimed at the 5-8 year old set. Each “Cat” card describes a cat along with her possessions, age, characteristics and so on. Kids can use these cards to explore issues in counting, graphing, statistics, and many other areas. I haven’t found a way to naturally embed a shortest path problem in the set, but perhaps the more creative of you can create a game that illustrates the concept of NP-completeness (and, coincidentally, keeping the kids quiet for a very long time).
I would hope that items like this (along with all the other things Dr. Nic offers) would spark interest in “our” type of mathematics. If you have a kids of the appropriate age (or are a kid of that age who happens to read Operations Research blogs) or know someone or a school that could use this resource, I hope you can support her Kickstarter or her other offerings. And look for a card named “Trafalgar” (I hope) in the final edition of the Cat cards!
As President of IFORS I write a quarterly column for its IFORS Newsletter (which I highly recommend). This is my column for September 2016.
As I write this, I have just returned from a EURO (the Association of European Operational Research Societies) conference in Poznan, Poland. It was a fascinating conference with interesting plenary sessions, a wide range of technical talks, and outstanding social activities to encourage interactions among participants. EURO is a grouping of IFORS member societies based mainly in Europe and is a very successful organization with robust publications, active working groups on many topics, conferences and workshops, summer schools for doctoral students, and many other activities.
EURO is just one of the regional groupings of IFORS. Two other active groups are APORS (Asia-Pacific Operational Research Societies) and ALIO (Association of Latin-Iberoamerican Operational Research Societies) grouping operational research societies in their respective regions. Administratively, IFORS has also defined NORAM (North America) as a regional grouping, but it consists just of the United States society (INFORMS) and the Canadian Society (CORS/SCRO), both of which are extremely active on their own, though they periodically combine for some joint activities.
Regional groupings provide an extremely important level between the national societies and IFORS. Perhaps most importantly, their conferences allow researchers and, particularly, students to experience a broader audience than national society meetings. If operational research is going to reach its potential, there is much work to be done at the national and regional levels. The meetings of EURO, ALIO and APORS facilitate interactions among people with similar issues and institutions. While a large global meeting can explore the breadth of operational research, regional meetings provide the structures to let operational research have an immediate impact.
In early October, ALIO will hold its regional meeting (called CLAIO) in Santiago, Chile. Santiago is one of the most interesting cities in Latin America, and October should provide great weather. The conference has a broad mix of plenary speakers, including Monique Guignard-Spielberg, the IFORS Distinguished Lecturer, speaking on one of my first loves: lagrangian relaxation. The IFORS Administrative Committee will be getting together at the conference, so this will also be a chance to meet the members of the AC to talk about directions of IFORS.
The next meeting of APORS will be held in 2018 in Kathmandu, Nepal with the theme “OR and Development”. EURO meets every year where there is not an IFORS conference, so its next meeting is in 2018 in Valencia Spain, followed by its 2019 conference in Dublin, Ireland.
I greatly enjoy my time at the regional meetings. Each one is different, reflecting both the country where the conference is organized and the region for which the conference is designed. I have met many people I would not have met otherwise, and I have seen how operational research is being used to meet the particular needs of regions around the world. I highly recommend attending both your regional conference, and the conferences of other regions.
I, of course, also recommend attending the conference when all these regions get together: the IFORS Triennial, to be held in Quebec City, Canada July 17-21. This is the conference where the world comes together to celebrate operational research: I hope to see you there!
As President of IFORS, I write a quarterly column on operational research issues for the IFORS News. Here is my June, 2016 column.
When I was a doctoral student way back in the 1980s, getting and using data was a tremendous impediment to finishing a dissertation. Data was precious and very difficult to obtain. Even when received, data often was in an unusable form, involving arcane formatting and coding. We had email, but I can’t recall using it very often. I do recall sending paper letters asking for information, with the resulting weeks before getting a response. Fortunately, I was at a top research university in the United States (Georgia Tech): the data situation elsewhere was undoubtedly worse.
The world has certainly changed. Now, companies and organizations are drowning in data with countless systems generating mega-, giga-, tera-, and even petabytes of data. In 2001, when I first put together a data mining course at Carnegie Mellon, I breathlessly talked about how the books at the U.S. Library of Congress held 20 terabytes of data, then an unimaginable number. I can now buy 20 terabytes of storage for my computer for about $500. Companies like Google, Facebook, Baidu, Twitter and many more take in hundreds of petabytes of data per day.
And, excepting privacy restrictions, this data is not slowed down by national borders. While most of us do not have the bandwidth or computing capability to handle petabytes of data, the kilo- or megabytes of data used by most operational research models are much easier to handle. For any place with a reasonable connection to the internet, data is just a few clicks away.
This has been a tremendous boon to international operational researchers. If you are doing research in integer programming, you have immediate access to MIPLIB, a library of challenging mixed-integer programming instances. You can send instances to NEOS, an online server that can solve a huge range of problems, including linear, mixed-integer, semidefinite, and much, much more. Similar data sources and system exist for a wide range of operational research areas. The internet has been a tremendous force for uniting disparate researchers from around the globe.
But companies around the world are faced with a huge problem: what to do with the data. Whether it be the petabytes of a huge, internet-based company or the kilobytes of a locally run firm, companies need to translate their data into information into knowledge into better decisions. And that that challenge is exactly what operational research is all about. We turn data into decisions. And we do it on a global scale.
Many people recognize company’s needs and I see over and over again attempts to turn data into decisions without understanding that there are a set of tools and skills that we have developed over the past 60 years that do exactly that. We, as a field, need to recognize and embrace the changes in the world. The Age of Analytics should lead to the Age of Operational Research.
My question to you is: what can IFORS do to help individuals and national societies bring on the Age of Operational Research? We bring together people at our conferences, we publish results in our journals, we aid in the education of young people through our support of summer and winter schools, we encourage and support the creation of new national OR societies. What else should we be doing?
I welcome your thoughts and comments at trick@cmu.edu. And I hope to see many of you at an upcoming conference, be it EURO in Poznan, INFORMS in the US, or any other conference where our paths cross. And don’t forget to put IFORS 2017 in Quebec City on your calendar: July 17-21, 2017. And Seoul 2020!
As President of IFORS (the International Federation of Operational Research Societies), I write a quarterly column for the IFORS News. I am biased, but I think the newsletter is amazingly well done (thanks Elise!) and I highly recommend reading all of it. Here is my March 2016 column.
I recently received an email from some conference organizers asking for IFORS to co-sponsor their conference. As part of the incentive for us to do so, they offered a reduced registration fee for “all your members”. I spent some time pondering what that might mean for IFORS. The IFORS membership consists of 52 member societies. Did they mean to offer reduced registration to the nearly 30,000 members of our constituent societies? That would certainly put a dent into their regular fee registrations! Or perhaps they had in mind that our societies might register on their own? “Hi, I am France. Can I get a room for 440 please?” Clearly the concept of “society of societies” is not common, and an aspect that makes IFORS unusual in the operational research world.
I have been thinking of this in the context of “member services”. When I was President of INFORMS (our United States-based society) 15 years ago, a major theme of my presidency was examining why people joined societies and what services a society should provide to encourage membership. The year 2002 was a year in which membership in INFORMS continued to decline, and some worried that this was a harbinger of the death of operations research. In retrospect, nothing could be further from the truth with many societies showing recent increases in membership, not least due to the rise of “analytics”. But spending time thinking about members and their needs was a good thing to do. During that retrospection, we identified services that we lacked and services that were mispriced. By concentrating on the members, INFORMS became, I believe, a society more relevant to its membership.
What does it mean for IFORS to consider member services? While some IFORS services are aimed at the 30,000 members of our membership, I do believe we need to think more about what we offer two distinct groups. The first is the membership itself: how is IFORS helping the national societies and regional groupings be stronger? What services are we offering that make it clear why a society should be a member of IFORS? How are we helping our four regional groupings of EURO, ALIO, APORS and NORAM? Of course, given the range of societies and their needs, it is clear that different members need different things. IFORS members range in size from those with thousands of members to societies whose membership can be comfortably seated around a restaurant table, and it is unlikely that any service will be relevant to all.
As a step towards understanding the needs of our members better, the IFORS Administrative Committee will be doing a series of breakfasts at major OR conference (EURO, INFORMS, and CLAIO this year). On a personal level, I am eager to meet with the various societies during my travels over the next years. I can’t promise to get to all 52 member countries, but I am going to try to visit as many as I possibly can!
The second group that we need to provide services for are those in operational research without a national society. We know that OR is everywhere, so IFORS should play an active role in encouraging the development of OR communities where none currently exist. There are 193 members of the United Nations which means IFORS has at least 141 members to go.
These are great times for operational research. There is increased interest in our field, and those whose skills encompass OR and analytics are increasingly successful. IFORS can play a strong role in a corresponding success for operational research societies, both existing and those to come.
I’m a sportswriter who is bound for the Olympics, and I’m writing an article about maximizing the number of events I see in a particular day.
I thought the input of a mathematician with expertise in these matters would be helpful to the story.
This was an interesting start to day a month ago. I received this email from New York Times reporter Victor Mather via University of Waterloo prof Bill Cook. Victor had contacted Bill since Bill is the world’s foremost expert on the Traveling Salesman Problem (he has a must-read book aimed at the general public called In Pursuit of the Traveling Salesman: Mathematics at the Limits of Computation). The TSP involves visiting a number of sites while traveling the minimum distance. While Victor’s task will have some aspects of the TSP, there are scheduling aspects that I work on so Bill recommended me (thanks Bill!).
Victor’s plan was to visit as many Olympic events in Rio as he could in a single day. This was part of a competition with another reporter, Sarah Lyall. Victor decided to optimize his day; Sarah would simply go where her heart took her. Who would see more events?
Victor initially just wanted to talk about how optimization would work (or at least he made it seem so) but I knew from the first moment that I would be optimizing his day if he would let me. He let me. He agreed to get me data, and I would formulate and run a model that would find his best schedule.
On the day they chose (Monday, August 15), there were 20 events being held. 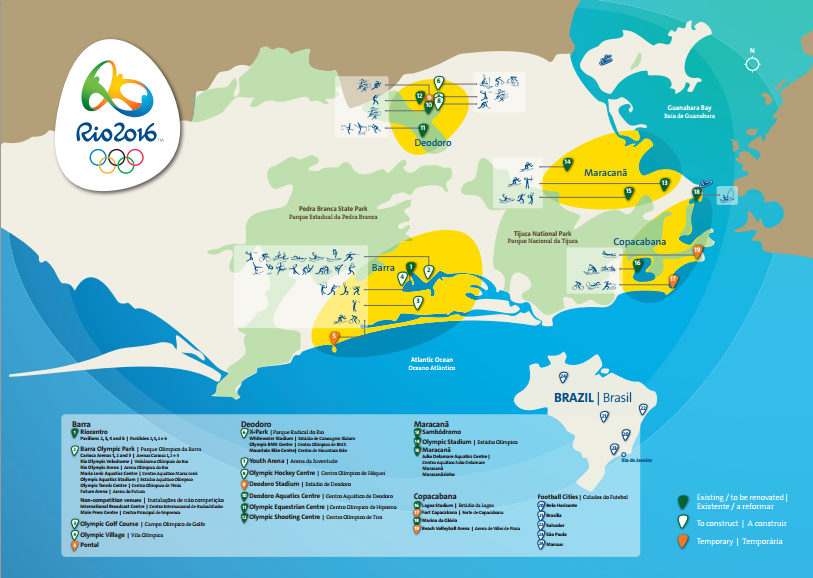 The map shows that the venues are all spread out across Rio (a dense, somewhat chaotic, city not known for its transportation infrastructure). So we would have to worry about travel distance. Victor provided an initial distance matrix, with times in minutes (OLY times). As we will see, this matrix must have been created by someone who had a few too many caipirinhas on Copacabana Beach: it did not exactly match reality.
So far the problem does look like a TSP: just minimize the distance to see 20 sites. The TSP on 20 sites is pretty trivial (see a previous blog post for how hard solving TSPs are in practice) so simply seeing the sites would be quite straightforward. However, not surprisingly Victor actually wanted to see the events happening. For that, we needed a schedule of the events, which Victor promptly provided:
Badminton 8:30 am – 10:30 am // 5:30 pm -7
Basketball 2:15 pm – 4:15 pm// 7 pm -9 pm // 10:30 pm – midnite
Beach Volleyball 4 p.m.-6 p.m. // 11pm – 1 am
Boxing 11 am-1:30 pm, 5 pm – 7:30 pm
Canoeing 9 am – 10:30 am
Cycling: 10 a.m. – 11 am /// 4 pm – 5:30
Diving 3:15 pm -4:30
Equestrian 10 am- 11 am
Field Hockey 10 am – 11:30 am // 12:30 –2 // 6-7:30 pm // 8:30 pm -10
Gymnastics 2 pm -3 pm
Handball: 9:30 am- 11 am// 11:30 – 1pm //2:40 -4 //4:40 – 6 pm // 7:50 – 9:10 pm // 9:50 pm -11:10
Open water Swimming 9 am – 10 am
Sailing 1 pm – 2 pm
Synchronized swimming: 11 am- 12:30
Table tennis 10 am -11 am // 3pm -4:30 // 7:30pm – 9
Track 9:30 am -11:30 am // 8:15pm -10 pm
Volleyball 9:30 am- 10:30 am // 11:30 – 12:30 // 3pm – 4 pm // 5 pm – 6 pm // 8:30 pm -9:30 // 1030 pm -11:30
Water polo 2:10 pm – 3 pm // 3:30 -4:20 //6:20 -7:10 // 7:40 – 8:30
Weightlifting 3:30 – 4:30 pm // 7 pm- 8 pm
Wrestling 10 am – noon // 4 pm- 6 pm
Many events have multiple sessions: Victor only had to see one session at each event, and decided that staying for 15 minutes was enough to declare that he had “seen” the event. It is these “time windows” that make the problem hard(er).
With the data, I promptly sat down and modeled the problem as an mixed-integer program. I had variables for the order in which the events were seen, the time of arrival at each event, and the session seen for each event (the first, second, third or so on). There were constraints to force the result to be a path through the sites (we didn’t worry about where Victor started or ended: travel to and from his hotel was not a concern) and constraints to ensure that when he showed up at an event, there was sufficient time for him to see the event before moving on.
The objective was primarily to see as many events as possible. With this data, it is possible to see all 20 events. At this point, if you would like to see the value of optimization, you might give it a try: can you see all 20 events just by looking at the data? I can’t!
But there may be many ways to see all the events. So, secondarily, I had the optimization system minimize the distance traveled. The hope was that spending less time on the buses between events would result in a more robust schedule.
I put my model in the amazing modeling system AIMMS. AIMMS lets me input data, variables, constraints, and objectives incredibly quickly and intuitively, so I was able to get a working system together in a couple of hours (most of which was just mucking about with the data). AIMMS then generates the integer program which is sent to Gurobi software (very fast effective mixed-integer programming solution software) and an hour later I had a schedule.
| start | Arrival | Next travel time |
| canoe | 9:00 | 20 |
| open swimming | 9:35 | 45 |
| equestrian | 10:35 | 35 |
| wrestling | 11:25 | 10 |
| synchro | 12:15 | 30 |
| sailing | 13:00 | 30 |
| gymnastics | 14:00 | 10 |
| handball | 14:40 | 10 |
| basketball | 15:05 | 10 |
| diving | 15:30 | 10 |
| cycling | 17:00 | 30 |
| beach volleyball | 17:45 | 30 |
| badminton | 18:40 | 5 |
| boxing | 19:00 | 5 |
| weightlifting | 19:20 | 5 |
| table tennis | 19:40 | 10 |
| water polo | 20:05 | 35 |
| hockey | 20:55 | 35 |
| track | 21:45 | 20 |
| volley | 22:30 | |
| end | 22:45 |
This schedule has 385 minutes on the bus.
I discussed this problem with my colleague Willem van Hoeve, who spent about five minutes implementing a constraint programming model (also in AIMMS) to confirm this schedule. He had a access to a newer version of the software, which could find and prove optimality within minutes. Unfortunately my version of the software could not prove optimality overnight, so I kept with my MIP model through the rest of the process (while feeling I was driving a Model T, while a F1 racecar was sitting just up the hallway). CP looks to be the right way to go about this problem.
I spent some time playing around with these models to see whether I could get something that would provide Victor with more flexibility. For instance, could he stay for 20 minutes at each venue? No: the schedule is too tight for that. So that was the planned schedule.
But then Victor got to Rio and realized that the planned transportation times were ludicrously off. There was no way he could make some of those trips in the time planned. So he provided another transportation time matrix (olympics3) with longer times. Unfortunately, with the new times, he could not plan for all 20: the best solution only allows for seeing 19 events.
| Event | Arrival | Next Travel | Slack | |
| canoe | 9:00 | 30 | ||
| track | 9:45 | 45 | ||
| equestrian | 10:45 | 35 | ||
| synchro | 11:35 | 60 | 0:10 | |
| sailing | 13:00 | 60 | ||
| gymnastics | 14:15 | 15 | ||
| water polo | 14:45 | 15 | ||
| diving | 15:15 | 15 | 0:25 | |
| cycling | 16:10 | 15 | ||
| handball | 16:40 | 15 | ||
| wrestling | 17:10 | 25 | ||
| boxing | 17:50 | 15 | ||
| badminton | 18:20 | 15 | 0:10 | |
| weightlifting | 19:00 | 15 | 0:35 | |
| table tennis | 20:05 | 25 | ||
| basketball | 20:45 | 35 | 0:10 | |
| hockey | 21:45 | 45 | 0:30 | |
| volley | 23:15 | 30 | ||
| beach volleyball | 0:00 | |||
So that is the schedule Vincent started with. I certainly had some worries. Foremost was the travel uncertainty. Trying to minimize time on the bus is a good start, but we did not handle uncertainty as deeply as we could have. But more handling of uncertainty would have led to a more complicated set of rules and it seemed that a single schedule would be more in keeping with the challenge. The morning in particularly looked risky, so I suggested that Victor be certain to get to gymnastics no later than 2:15 in order to take advantage of the long stretch of close events that follow. Sailing in particular, looked to be pretty risky to try to get to.
I had other worries: for instance, what if Victor arrived during half-time of an event, or between two games in a single session? Victor probably wouldn’t count that as seeing the event, but I did not have the detailed data (nor an idea of the accuracy of such data if it did exist), so we had to hope for the best. I did suggest to Victor that he try to keep to the ordering, leaving an event as soon as 15 minutes are up, hoping to get a bit more slack when travel times worked out better than planned (as-if!).
So what happened? Victor’s full story is here and it makes great reading (my school’s PR guy says Victor is “both a reporter and a writer”, which is high praise). Suffice it to say, things didn’t go according to plan. The article starts out:
There are 20 [events] on the schedule on Monday. Might an intrepid reporter get to all of them in one day? I decide to find out, although it doesn’t take long to discover just how difficult that will be.
The realization comes while I am stranded at a bus stop in Copacabana, two and a half hours into my journey. The next bus isn’t scheduled for three hours. And I’ve managed to get to exactly one event, which I could barely see.
I had given him some rather useless advice in this situation:
“Something goes wrong, you reoptimize,” Professor Trick had cheerfully said. This is hard to do sitting on a bus with the computing power of a pen and a pad at my disposal.
Fortunately, he got back in time for the magical sequence of events in the afternoon and early evening. One of my worries did happen, but Victor agilely handled the situation:
Professor Trick urged me in his instructions to “keep the order!” So it is with some trepidation that I go off-program. Wrestling is closer to where I am than handball, and it looks like I will land at the handball arena between games. So I switch them. It’s the ultimate battle of man and machine — and it pays off. I hope the professor approves of my use of this seat-of-the-pants exchange heuristic.
I do approve, and I very much like the accurate use of the phrase “exchange heuristic”.
At the end Victor sees 14 events. 19 was probably impossible, but a few more might have been seen with better data. I wish I had used the optimization code to give Victor some more “what-ifs”, and perhaps some better visualizations so his “pen and pad optimization” might have worked out better. But I am amazed he was able to see this many in one day!
And what happened to Sarah, the reporter who would just go as she pleased? Check out her report, where she saw five events. If Victor went a little extreme getting a university professor to plan his day, Sarah went a little extreme the other way in not even looking at a map or a schedule.
This was a lot of fun, and I am extremely grateful to Victor for letting me do this with him (and to Bill for recommending me, and to Willem for providing the CP model that gave me confidence in what I was doing).
I’ll be ready for Tokyo 2020!
I like to think there are some solid foundations to my life. I will be able to do the Monday New York Times crossword and I will not be able to do the Thursday version. My dental hygienist will not be satisfied with the amount of flossing I do. I will get my favorite spaghetti meal served on my birthday.
And I can trust American Scientist to write articles that teach me science in an accessible, yet challenging, way. American Scientist is the magazine of the honor society Sigma Xi and is my favorite science magazine since the demise of The Sciences, my all-time favorite science magazine. Or it was.
That particular pillar of my existence crumbled into dust today as I was reading an otherwise interesting article on “Paradoxes, Contradictions, and the Limits of Science” by Noson Yanofsky. In this article, there is a sidebar on the Traveling Salesman Problem that makes me weep.
It is fortunate that they have put this behind their firewall so as to minimize the damage they have done. But let me briefly describe: there is a map of the United States, along with a truly atrocious Traveling Salesman tour through the US, apparently visiting each zip code (approximately 43,000 zip codes). The tour is created by “Hilbert Curves” and is “about 75% optimal”. Then, the inevitable, “Finding the actual shortest route would take a computer essentially an infinite amount of time to compute”. Cue the sidebar: “But what about going to 100 different cities? A computer would have to check 100x99x98x….x2x1 possible routes.” They then helpfully expand that into the 157 digit number of potential routes. “The computer would have see how long the route takes, and then compare all of them to find the shortest route.”
The sidebar continues with the drivel of computer speed and the number of centuries it would take.
No, no. 100! times no. It is not necessary to check all the routes. 100 cities TSPs can be solved to proved optimality in a very short period of time. And even 43,000 zip codes can be solved to optimality with a non-infinite (and quite practical) amount of computation. Using integer programming and specialized techniques, Bill Cook and his gang at Concorde have solved to optimality problems with up to 85,900 cities. The “zip code” problem is just like the problems Cook has solved, just smaller.
The Traveling Salesman problem is NP-complete (or NP-hard depending what you mean by the TSP). But as a computational approach, the “figuring out how big 100! is and that is the time” completely misunderstands the role optimization and algorithms play in truly solving hard problems (I mean it: the true optimal is found and proved to be optimal). My most recent blog post (sadly too long ago) was on this very subject. Perhaps I should rename this blog “Michael Trick’s Rants about Complete Enumeration Arguments”.
Even if you want to call this instance impossible to solve, why would you ever use a Hilbert Curve heuristic for it? Don’t get me wrong: I am a student of John Bartholdi and his paper with Loren Platzman on spacefilling curves and his paper applying this to Meals-on-Wheels scheduling changed my life. But these techniques don’t give great tours (they have lots of other great properties).
It appears American Scientist has taken this tour from this webpage. The published map is the bottom one on the page. The resulting tour is clearly not good. Practically any other modern heuristic would do better. This is no complaint about Robert Kosara, the author of the original article: the page describes what he wanted to do, and he did it well. But for American Scientist to put this forward as an example of the state-of-the-art heuristic approach completely misrepresents the state of the art for heuristic approaches. And I have no idea what 75% optimal means: the tour is longer than optimal, of course.
I don’t know if this means I should not trust American Scientist in areas that are not my specialty. On something I know a bit about, the magazine has failed miserably.
… or “The Traveling Salesman Problem is Not That Hard”.
When I talk to people about what I do for a living, I often face blank stares (or, worse, rapidly retreating backs) when I describe problems like the Traveling Salesman Problem.
Me: “Well, suppose the dots on this napkin represent cities, and you want to find the shortest route that visit them. How could you do it?”
Them: Quick scribble through the dots. “There! So you spend the day drawing lines through dots?”
Me: “No, no! Suppose there are 1000 cities. Then…. well, there are 1000*999*998*…*2*1 ways through all the dots, and that is more than the number of freckles on a dalmatian’s back, so I look for better ways to draw lines through dots.
And I fall into the same old trap. I try to convince people the Traveling Salesman problem is hard by saying there are a lot of solutions to look through. And that is an extremely misleading argument that I am now convinced does more harm than good.
Imagine if I had said one of the following:
Of course, all of these are nonsense: having lots of possibilities may be necessary for a problem to be hard, but it is certainly not sufficient. Sorting is a problem that anyone can find a reasonable solution for. Shortest path is a bit harder, and linear programming (problem 2) is harder still. But all can be solved in time much, much less than the approaches above suggest.
So why do we use this argument for the Traveling Salesman problem? We know from complexity theory that the problem is NP-Hard, so most of us believe that there is not now a known polynomial time algorithm (there are still some who believe they have such an algorithm, but they are in the very, very tiny minority), and many of us believe that no such algorithm exists.
But that does not mean complete enumeration is necessary: it is easy to come up with approaches that go through less than the full n! solutions to the Traveling Salesman problem (see the postscript for one example). This is not surprising. Complete enumeration for Satisfiability is 2^n but there are methods known that take time proportional to something like 1.4^n [Edit: as per a comment, I meant 3-Sat]. Still exponential but not complete enumeration. And there is a big difference between 2^n and 1.00001^n (or 2^n/10^10) even if complexity theory likes to call them all “exponential”.
But the “complete enumeration” statement is even more harmful since it glosses over a much more important issue: many “hard” problems (in the complexity theory meaning) are not particularly hard (in the English sense), if you limit yourself to instances of practical interest. Due to the tremendous amount of work that has been done on the Traveling Salesman Problem, the TSP is one such problem. If you have an instance of the TSP of practical interest (i.e. it makes a difference to your life if you solve it or not, and it is really a TSP, not the result of some weird set of set of reductions from some other problem), then I bet you the Concorde program of Bill Cook and others will get you a provably optimal solution in a reasonable amount of time. In fact, I would be really interested in knowing the smallest “real” instance that Concorde cannot solve in, say, one day, on a normal laptop computer.
Being hard-to-solve in the complexity theory sense does not mean being hard-to-solve in the common language sense. And neither have much to do with the number of possible solutions that complete enumeration might go through.
As an example of this confusion, here is a paragraph from Discover on work done by Randy Olson:
Planning a vacation is a daunting task, so why not let big data take the reins?
That’s exactly what data scientist Randy Olson did. Using specialized algorithms and Google Maps, Olson computed an optimized road trip that minimizes backtracking while hitting 45 of Business Insider’s “50 Places in Europe You Need to Visit in Your Lifetime.” (Five locations were omitted simply because you can’t reach them by car.)
Mapping software has come a long way, but for this kind of challenge it’s woefully inadequate. Google Maps’ software can optimize a trip of up to 10 waypoints, and the best free route optimization software can help with 20. But when you’re looking to hit 45 or 50 landmarks, things get complicated.
According to Olson, a computer would need to evaluate 3 x 10^64 possible routes to find the best one. With current computing power, it would take 9.64 x 10^52 years to find the optimal route to hit all your desired locations — Earth would have long been consumed by the Sun before you left the house. So Olson used a clever workaround, based on the assumption that we don’t need to find the absolute best route, but one that’s pretty darn good.
Now, all this is based on an article Olson wrote months ago, and this has all be hashed over on twitter and in blogs (see here and here for example), but let me add (or repeat a few points):
In Olson’s defense, let me make a few other points:
But the bottom line is that real instances of the TSP can generally be solved to optimality. If, for whatever reason, “close to optimal” is desired, there are zillions of heuristics that can do that. The world is not eagerly waiting a new TSP heuristic. Overall, the TSP is not a particularly good problem to be looking at (unless you are Bill Cook or a few other specialists): there is just too much known out there. If you do look at it, don’t look at 50 point instances: the problem is too easy to be a challenge at that size. And if you want to state that what you learn is relevant to the TSP, please read this (or at least this, for a more accessible narrative) first. There are other problems for which small instances remain challenging: can I suggest the Traveling Tournament Problem?
Finally, let’s drop the “number of solutions” argument: it makes 50 point TSPs look hard, and that is just misleading.
Postscript: an example of not needing to do complete enumeration for the Traveling Salesman Problem
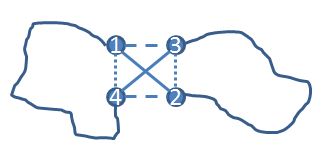
For instance, take four cities 1, 2, 3, and 4, and denote the distance matrix to be D (assumed to be symmetric, but similar arguments work for the asymmetric case). Then one of D(1,2)+D(3,4), D(1,3)+D(2,4), or D(1,4)+D(2,3) is maximum (if there are ties choose one of the maximums), say D(1,2)+D(3,4). It is easy to show that the optimal tour does not have both the edges (1,2) and (3,4), since otherwise a simple exchange would get a tour no worse. If you want to be convinced, consider the following diagram. If a tour used (1,2) and (3,4), then an alternative tour that uses either the dashed edges (1,3) and (2,4) or the dotted edges (1,4) and (2,3) would still be a tour and would be no longer than the (1,2) (3,4) tour. As drawn, the dashed edges give a shorter tour.
If you are convinced of that, then here is an algorithm that doesn’t enumerate all the tours: enumerate your tours building up city by city, but start 1, 2, 3, 4. At this point you can stop (and not move on to 1,2,3,4,5) and move on to 1,2,3,5 and so on. In doing so, we avoided enumerating (n-4)! tours. Ta da! Of course, you can do this for all foursomes of points, and don’t need to only have the foursome in the initial slots. All this can be checked quickly at each point of the enumeration tree. How many tours are we left with to go through? I don’t know: it is still exponential, but it is a heck of a lot less than n! (and is guaranteed to be less than that for any instance). Maybe even less than the time it takes for the sun to consume the earth.
It has been almost a year since I had a blog entry here. Not that I don’t have a lot to say! I am using twitter more, and I do have ideas for blog entries in cases where 140 characters is not enough. But there is limited time.
But I think something more fundamental is at work. What is the state of blogging, and, in particular, the operations research blogging world? It doesn’t appear all that healthy to me, but perhaps I am not seeing things correctly.
I think the blogging world was badly hurt by the cancellation of Google Reader. At least for me, Google Reader was a fast a convenient way to follow the blogging world. And, beyond me, I had creating a public list of OR Blogs, and a public feed of OR blog entries. It seemed to be well used, but those ended with the end of Reader. It is harder to get word out about OR blogging.
I have tried to continue aspects of these listings on this page with a feed of OR blogs (also in sidebar) but it is much less convenient.
I also think the relentless onslaught of comment spam discouraged (and perhaps still discourages) people from trying out blogging.
Today I went through my list of OR blogs to see who has posted in the past year, and was distressed to see how few have done so. Even with a pretty broad view of what an OR Blog is, it came to only about 40 people, with many of those (including myself!) barely meeting the “posted in the last year” requirement.
Those that remain are a fantastic source of information. I think particularly of Laura McLay’s Punk Rock Operations Research and Anna Nagurney’s RENeW as must-read entries. But there now seem to be few active bloggers.
Am I missing a ton of entries in the OR Blogging world (let me know if I am missing some from my list)? Has the world of twitter taken over from the long-form journalism that blogging provides?
In any case, I will make an effort to write more and welcome thoughts about how to strengthen the OR blogging community.