Models are useful in their own right: they allow for a formal definition of a problem and can be useful in thinking about a problem. Linear programming models are particularly useful, however, because it is easy to have a computer solve for the optimal decision values.
For a model with only two variables, it is possible to solve the problem without a computer by drawing the feasible region and determining how the objective is optimized on that region. We go through that process here. The purpose of this exercise is to give you intuition and understanding of linear programming models and their solution. In any real application, you would use a computer to solve even two variable problems (we outline how to use Excel's Solver routine to find solutions in the next section).
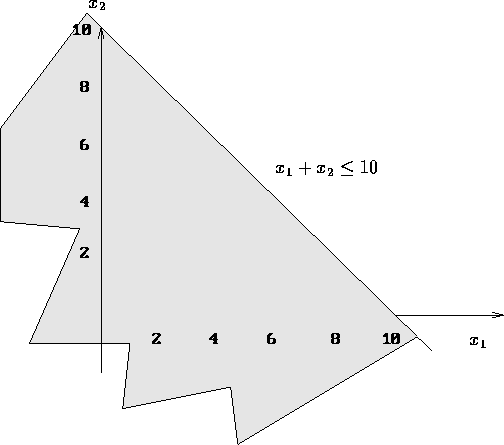
We can represent a model with two variables by labeling the axes of a
graph with each of the variables. The entire graph then represents
possible decisions. Constraints are represented by lines on the
graph, with the feasible region lying on one side of the line. The
following figure illustrates this with the constraint ![]() .
.
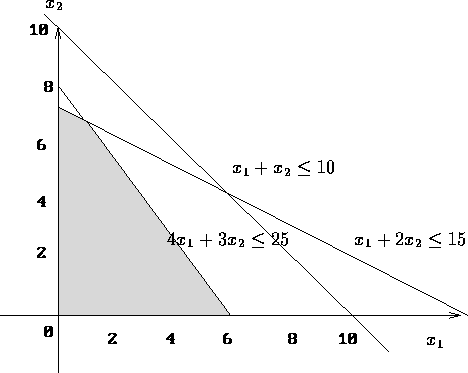
We can continue this process and add in all of the constraints. Since every constraint must be satisfied, the resulting feasible region is the intersection of the feasible region for each constraint. This is shown in the following figure.
Note that just graphing the model gives us information we did not have
before. It seems that the Chip constraint ( ![]() ) plays
little role in this model. This constraint is dominated by other
constraints.
) plays
little role in this model. This constraint is dominated by other
constraints.
Now, how can we find the optimal solution? We can include the objective function on this diagram by drawing iso-profit lines: lines along which the profit is the same. Since our goal is to maximize the profit, we can push the isoprofit line out until moving it any further would result in no feasible point (see diagram, z represents profit). Clearly the optimal profit occurs at point X.
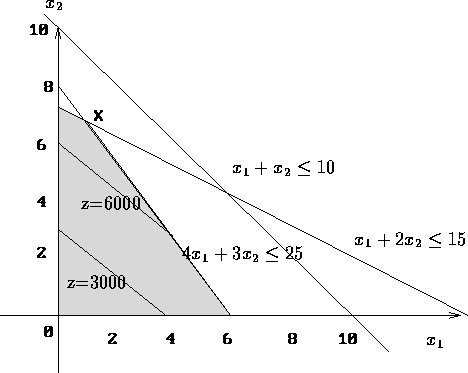
Figure 5.3: Finding Optimal Profit
What are the variable values at point X. Note that X is the intersection of the constraints:
![]()
We discussed in the previous section how to solve such equations: the
solution here is ![]() and
and ![]() . The optimal decision is to
produce 1,000 notebooks and 7,000 desktops, for a profit of
$7,750,000.
. The optimal decision is to
produce 1,000 notebooks and 7,000 desktops, for a profit of
$7,750,000.