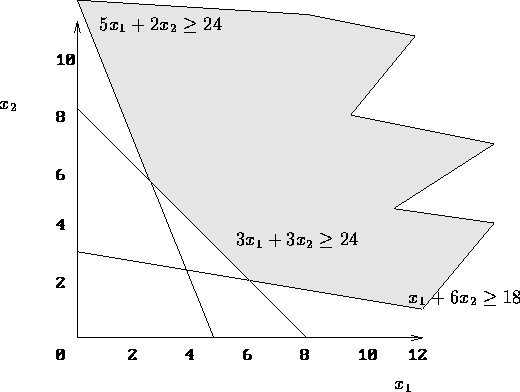
Figure 5.4: Marketing example
Since this model has only two variables, we can solve the problem in two ways: graphically and using SOLVER (with SOLVER being much easier). We start by solving this graphically.
The first step is to graph the feasible region, as given in the following figure:
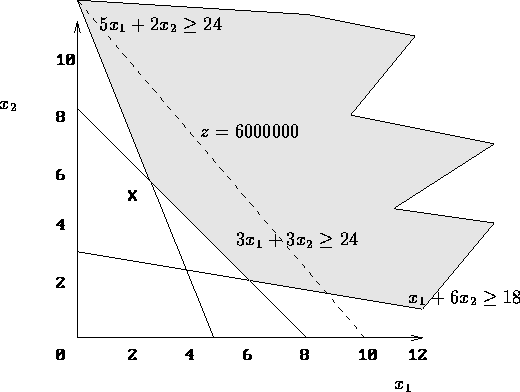
The next step is to put some iso-cost lines on the diagram: lines representing points that have the same cost. We mark the optimal point with an X.

Figure 5.5: Marketing example with Isocost Line
X is the intersection of the constraints:
![]()
The optimal solution is ![]() and
and ![]()