next up previous
Next: About this document Up: Quick Review of Linear Previous: Introduction

Example for Sensitivity Analysis

Tucker Inc. needs to produce 1000 Tucker automobiles. The company has four production plants. Due to differing workforces, technological advances, and so on, the plants differ in the cost of producing each car. They also use a different amount of labor and raw material at each. This is summarized in the following table:

tabular11

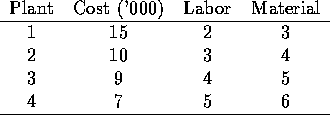
The labor contract signed requires at least 400 cars to be produced at plant 3; there are 3300 hours of labor and 4000 units of material that can be allocated to the four plants.

Attached is a formulation and LINDO output for this problem. Here are some questions to be answered:

  1. What are the current production quantities? What is the current cost of production?
  2. How much will it cost to produce one more vehicle? How much will we save by producing one less?
  3. How would our solution change if it cost only $8,000 to produce at plant 2? For what ranges of costs is our solution (except for the objective value) valid for plant 2?
  4. How much are we willing to pay for a labor hour?
  5. How much is our union contract costing us? What would be the value of reducing the 400 car limit down to 200 cars? To 0 cars? What would be the cost of increasing it by 100 cars? by 200 cars?
  6. How much is our raw material worth (to get one more unit)? How many units are we willing to buy at that price? What will happen if we want more?
  7. A new plant is being designed that will use only one unit of workers and 4 units of raw material. What is the maximum cost it can have in order for us to consider using it?
  8. By how much does plant 4 have to reduce its cost in order for us to consider using it? By how much does it have to reduce its material usage instead?
  9. By how much can the costs at plant 1 increase before we would not produce there?

 
 MIN     15 X1 + 10 X2 + 9 X3 + 7 X4
 SUBJECT TO
        2)   X1 + X2 + X3 + X4 =    1000
        3)   X3 >=   400
        4)   2 X1 + 3 X2 + 4 X3 + 5 X4 <=   3300
        5)   3 X1 + 4 X2 + 5 X3 + 6 X4 <=   4000
 END
 
 LP OPTIMUM FOUND AT STEP      3

        OBJECTIVE FUNCTION VALUE

        1)     11600.000    

  VARIABLE        VALUE          REDUCED COST
        X1       400.000000          0.000000
        X2       200.000000          0.000000
        X3       400.000000          0.000000
        X4         0.000000          7.000000


       ROW   SLACK OR SURPLUS     DUAL PRICES
        2)         0.000000        -30.000000
        3)         0.000000         -4.000000
        4)       300.000000          0.000000
        5)         0.000000          5.000000

 NO. ITERATIONS=       3

 RANGES IN WHICH THE BASIS IS UNCHANGED:
 
                           OBJ COEFFICIENT RANGES
 VARIABLE         CURRENT        ALLOWABLE        ALLOWABLE
                   COEF          INCREASE         DECREASE
       X1       15.000000         INFINITY         3.500000
       X2       10.000000         2.000000         INFINITY 
       X3        9.000000         INFINITY         4.000000
       X4        7.000000         INFINITY         7.000000
 
                           RIGHTHAND SIDE RANGES
      ROW         CURRENT        ALLOWABLE        ALLOWABLE
                    RHS          INCREASE         DECREASE
        2     1000.000000        66.666664       100.000000
        3      400.000000       100.000000       400.000000
        4     3300.000000         INFINITY       300.000000
        5     4000.000000       300.000000       200.000000

Carla Lee, a current MBA student, decides to spend her summer designing and marketing bicycling maps of Western Pennsylvania. She has designed 4 maps, corresponding to four quandrants around Pittsburgh. The maps differ in size, colors used, and complexity of the topographical relief (the maps are actually 3-dimensional, showing hills and valleys). She has retained a printer to produce the maps. Each map must be printed, cut, and folded. The time (in minutes) to do this for the four types of maps is:

tabular16

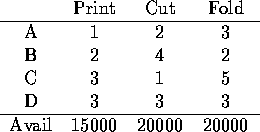
The printer has a limited amount of time in his schedule, as noted in the table.

The profit per map, based on the projected selling price minus printers cost and other variable cost, comes out to approximately $1 for A and B and $2 for C and D. In order to have a sufficiently nice display, at least 1000 of each type must be produced.

Attached is the formulation and LINDO output. Here are some questions to answer:

  1. What are the production quantities and projected profit?
  2. How much is Carla willing to pay for extra printing time? cutting time? folding time? For each, how many extra hours are we willing to buy at that price?
  3. Suppose we reduced the 1000 limit on one item to 900. Which map should be decreased, and how much more would Carla make?
  4. A fifth map is being thought about. It would take 2 minutes to print, 2 minutes to cut, and 3 minutes to fold. What is the least amount of profit necessary in order to consider producing this map? What is the effect of requiring 1000 of these also?
  5. The marketing analysis on D is still incomplete, though it is known that the profit of $2 per item is within $.25 of the correct value. It will cost $500 to complete the analysis. Should Carla continue with the analysis?

 
 MAX     A + B + 2 C + 2 D
 SUBJECT TO
        2)   A + 2 B + 3 C + 3 D <=   15000
        3)   2 A + 4 B + C + 3 D <=   20000
        4)   3 A + 2 B + 5 C + 3 D <=   20000
        5)   A >=   1000
        6)   B >=   1000
        7)   C >=   1000
        8)   D >=   1000
 END
 
 LP OPTIMUM FOUND AT STEP      8

        OBJECTIVE FUNCTION VALUE

        1)     10166.667    

  VARIABLE        VALUE          REDUCED COST
         A      1500.000000          0.000000
         B      1000.000000          0.000000
         C      1000.000000          0.000000
         D      2833.333252          0.000000


       ROW   SLACK OR SURPLUS     DUAL PRICES
        2)         0.000000          0.500000
        3)      3500.000000          0.000000
        4)         0.000000          0.166667
        5)       500.000000          0.000000
        6)         0.000000         -0.333333
        7)         0.000000         -0.333333
        8)      1833.333374          0.000000

 NO. ITERATIONS=       8

 RANGES IN WHICH THE BASIS IS UNCHANGED:
 
                           OBJ COEFFICIENT RANGES
 VARIABLE         CURRENT        ALLOWABLE        ALLOWABLE
                   COEF          INCREASE         DECREASE
        A        1.000000         1.000000         0.333333
        B        1.000000         0.333333         INFINITY 
        C        2.000000         0.333333         INFINITY 
        D        2.000000         1.000000         0.500000
 
                           RIGHTHAND SIDE RANGES
      ROW         CURRENT        ALLOWABLE        ALLOWABLE
                    RHS          INCREASE         DECREASE
        2    15000.000000      1000.000000      3666.666748
        3    20000.000000         INFINITY      3500.000000
        4    20000.000000      7000.000000      1000.000000
        5     1000.000000       500.000000         INFINITY
        6     1000.000000      1750.000000      1000.000000
        7     1000.000000       500.000000      1000.000000
        8     1000.000000      1833.333374         INFINITY


next up previous
Next: About this document Up: Quick Review of Linear Previous: Introduction

Michael A. Trick
Wed Sep 11 11:03:30 EDT 1996