Google Labs has a new tool called Google Correlate. Google provided some early correlation results during the 2008 flu season when it showed that search count for certain terms (like “flu” presumably) could be used to estimate the prevalence of flu in an area. This led to Google Flu Trends (it appears that currently only South Africa has many cases of the flu).
You can now play this game on your own data. Have a time series over the last 9 years or so? You can enter it into Google Correlate and see what search terms are correlated with the data.
Even easier is just entering a search term: it will then return other correlated search terms.
If you are going to periodically write in something called “Michael Trick’s Operations Research Blog”, it is clear what to do next: search on “Michael Trick” (it is required to egotistically search on your own name first, right?). No dice: I’m not popular enough to justify a search (sigh…).
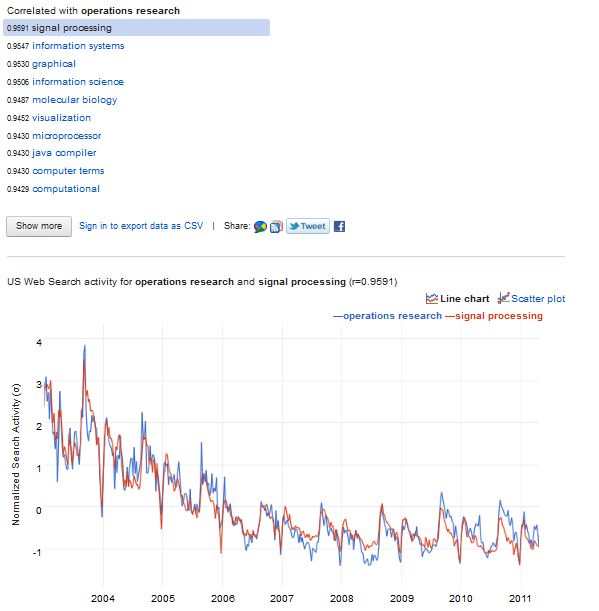
 But, of course, “operations research” works fine. What correlates with that phrase? Turns out lots of interesting things: “signal processing”, “information systems”, and … “molecular biology”? What are the common features on these terms? Well, they were relatively more common search terms in 2004-2005, relatively flat in the past three years, and have a strong seasonality, corresponding to the start of the academic year (“Hey, I signed up for Operations Research: what the heck is that?”). Whether it is operations research, signal processing or molecular biology, it appears lots of academic departments begin September with students frantically searching on their subjects.
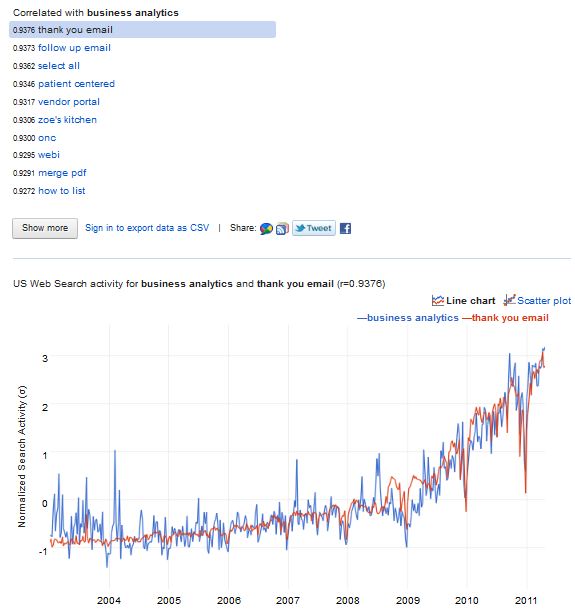
 We can try another term with some currency: “business analytics”. The result is somewhat surprising. “Thank you email”? “Vendor portal”? “Zoes Kitchen”? It seems hard to make much sense of this. As we know, “business analytics” is a relatively new term and the search quantity is less than that of “operations research” which perhaps explains the spurious correlations: there are so many terms that are searched as often as “business analytics” that the highest correlations come more or less randomly.
To data people like us (me, anyway), the ability to search correlations is endlessly fascinating. Shift the operations research time series by 13 weeks and what do you get: things like “portable mp3” and “retriever pictures”: clearly our students are bored with our course and are surfing around for something more entertaining. What does “management science” search correlate with? “introduction” and “social research”. Is there anything interesting to be learned by the differences in correlates between operations research and management science? Nothing springs to mind, but there might be a thesis or two there.
I am not sure what any of this means, but it sure is a great way to spend an early summer afternoon!
One thing I’ve noticed about results from Google Correlate and Trend is that “academic” search queries (like the names of fields and departments) represent a shrinking fraction of total search volume over the past decade. The absolute number of people searching for “operations research” may have actually grown during that time, but the normalized statistic (search volume index) that is reported has decreased. The normalization factor is the total number of all searches.
As internet usage expanded rapidly outside of its original stronghold in the academic world, this is to be expected. Things appear to level off in 2007-08.