As someone who teaches data mining, which I see as part of operations research, I often talk about what sort of results are worth changing decisions over. Statistical significance is not the same as changing decisions. For instance, knowing that a rare event is 3 times more likely to occur under certain circumstances might be statistically significant, but is not “significant” in the broader sense if your optimal decision doesn’t change. In fact, with a large enough sample, you can get “statistical significance” on very small differences, differences that are far too small for you to change decisions over. “Statistically different” might be necessary (even that is problematical) but is by no means sufficient when it comes to decision making.
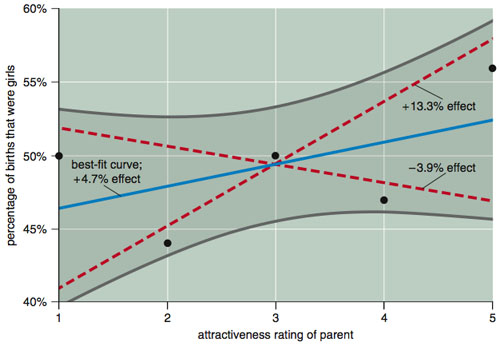
Finding statistically significant differences is a tricky business. American Scientist in its July-August, 2009 issue has a devastating article by Andrew Gelman and David Weakliem regarding the research of Satoshi Kanazawa of the London School of Economics. I highly recommend the article (available at one of the authors’ sites, along with a discussion of the article, and I definitely recommend buying the magazine, or subscribing: it is my favorite science magazine) as a lesson for what happens when you get the statistics wrong. You can check out the whole article, but perhaps you can get the message from the following graph (from the American Scientist article):

The issue is whether attractive parents tend to have more daughters or sons. The dots represent the data: parents have been rated on a scale of 1 (ugly) to 5 (beautiful) and the y-axis is the fraction of their children who are girls. There are 2972 respondents in this data. Based on the Gelman/Weakliem discussion, Kanazawa (in the respected journal Journal of Theoretical Biology) concluded that, yes, attractive parents have more daughters. I have not read the Kanazawa article, but the title “Beautiful Parents Have More Daughters” doesn’t leave a lot of wiggle room (Journal of Theoretical Biology, 244: 133-140 (2007)).
Now, looking at the data suggests certain problems with that conclusion. In particular, it seems unreasonable on its face. With the ugliest group having 50-50 daughters/sons, it is really going to be hard to find a trend here. But if you group 1-4 together and compare it to 5, then you can get statistical significance. But this is statistically significant only if you ignore the possibility to group 1 versus 2-5, 1-2 versus 3-5, and 1-3 versus 4-5. Since all of these could result in a paper with the title “Beautiful Parents Have More Daughters”, you really should include those in your test of statistical significance. Or, better yet, you could just look at that data and say “I do not trust any test of statistical significance that shows significance in this data”. And, I think you would be right. The curved lines of Gelman/Weakliem in the diagram above are the results of a better test on the whole data (and suggest there is no statistically significant difference).
The American Scientist article makes a much stronger argument regarding this research.
At the recent EURO conference, I attended a talk on an aspects of sports scheduling where the author put up a graph and said, roughly, “I have not yet done a statistical test, but it doesn’t look to be a big effect”. I (impolitely), blurted out “I wouldn’t trust any statistical test that said this was a statistically significant effect”. And I think I would be right.
what Euro conference were you at? you link is broken. i’m curious if sam savage was there at the conference. what are your thoughts on his new book http://www.sas.com/apps/pubscat/bookdetails.jsp?pc=62898 the flaw of averages?
Hi Mary: Oops: http://www.euro-2009.de (the 23rd European Conference on Operational Research in Bonn. I don’t think Sam was there. I have seen the “flaw of averages” talk before (I haven’t looked at the book) and have used some of his examples when I talk about the need for stochastic optimization in some of my courses.
I do enjoy a good academic smackdown once in awhile. Thanks for the tip on American Scientist too. I’ve tried a few science magazines and got so discouraged after the first two that I gave up on finding a decent one (as of now I just follow Nature on twitter and Wired Science blog).
Thanks for the link to the author’s web site; the AS article henceforth will be required reading in my regression seminar.
I teach in a business school, where one might (incorrectly) expect that students and faculty would grasp the difference between statistical significance (what we think we’re seeing might actually be there) and practical significance (some manager might give a darn about it). I once had to explain this difference to a doctoral student in production management (including the part about “if it looks big but it’s not statistically significant, it’s not practically significant, because it might not be there at all”). He was so amazed he wanted to write a journal article about the difference. Apparently this does not get adequate coverage in stats courses.
I believe Andrew said the more “academic” journals rejected this piece, which really says a lot about the state of our scholarship
And it doesn’t matter how much a study is discredited, it will still show up in the popular media: http://www.timesonline.co.uk/tol/news/uk/science/article6727710.ece