It is pretty clear that academic administration and blogging are perfect substitutes, at least in regard to time, if not satisfaction. After having an easy period earlier in the year when I racked up a dozen blog posts, administrative needs sucked up all my time, leading to the buildup of dust-bunnies at Ye Olde Blog. But it is the end of term, so perhaps I can get things cleaned out.
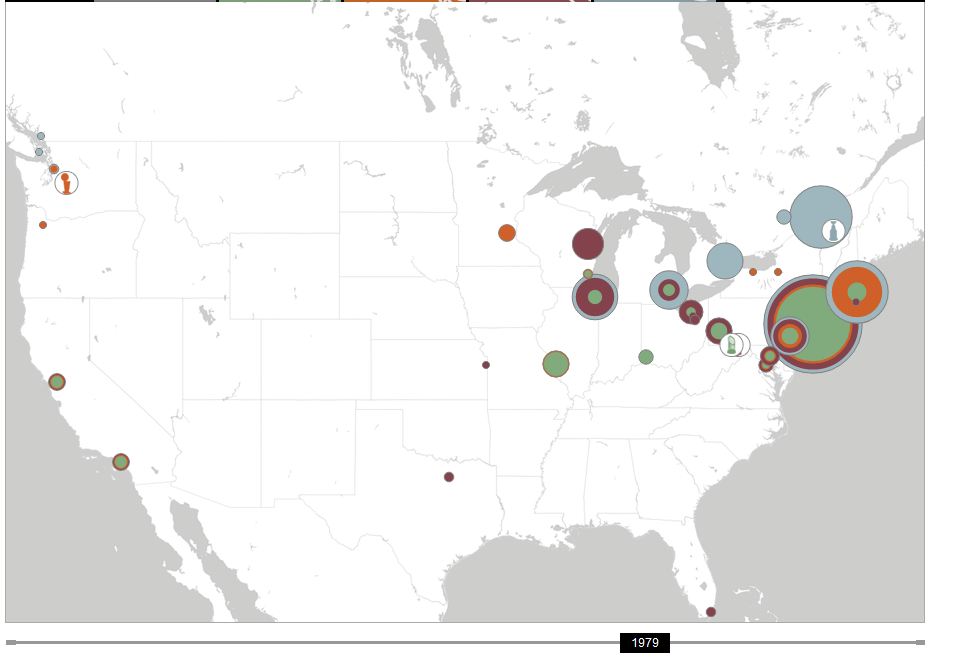
 Let me point out two recent sports-oriented items. First is a fascinating dynamic map from Slate showing the winning of sports championships in the four major US sports (football, baseball, hockey, and basketball). The progression is fascinating, and the graphical display gives far more information than the static listing does. It is a great example of the value of visualization, even if I can’t quite figure out what the value is. The graphic to the left shows a particularly good year: 1979 when Pittsburgh really was “The City of Champions”.
Second, there were two good articles on sports scheduling. The first was on NFL scheduling in the New York Times. Lots of people sent me this, since I’m part of the group that does Major League Baseball Scheduling. The article does a great job of talking about all difficulties there are in agreeing on a schedule. Ironically, some of these difficulties come from the ease at which it is possible to get NFL schedules. When it is possible to ask “What if we had Pittsburgh play New England in week 3?” and get back appropriate schedules quickly, it is tempting to ask a near-endless set of questions. Particularly when there are many interested parties and no particular rules for aggregating preferences.
Baseball scheduling doesn’t provide the same quick response. Due partially to the size of the schedule (2430 games or 780 series rather than the NFL’s 256 games) but due mainly to the scheduling difficulty of “good trips” (an issue of minimal importance to the NFL since teams return home after almost every game), the turn-around time on MLB schedules is measured in days or weeks, not minutes or hours. Which brings me to the second article: an article in the LA Times on baseball scheduling. It even quotes my partner Doug Bureman:
Bureman, whose company also does the scheduling for several major-college conferences, summed up the job this way:
“We’re kind of in the business of seeking perfection, knowing that you’re never going to get there.”
That is for sure: we are a long way from perfection! But this year has been fascinating due to realignment issues:
All of this gets even more jumbled in 2013 when MLB realigns, with the Houston Astros moving to the American League and both leagues having 15 teams. (Currently there are 16 in the NL, 14 in the AL.) Interleague games will then be spread through the season instead of being bunched together around midseason as they are now.
Feeney and her group are currently working on that 2013 schedule, and have found it to be quite a challenge. “We’re still struggling with the format,” she said.
For a sports scheduler, this “struggle” is a once-in-a-lifetime opportunity, and it has been tremendously fun and interesting to work out how that format might work.
In between bouts of academic administration!
First: glad to have you blogging again. Second: on a side note, in Slate’s dynamic map, the growing disks eventually start to touch each other and one is faced with the optimization problem of what to draw on top of what. It seems they use the heuristic of drawing larger disks below smaller disks. A few colleagues and I recently worked on this problem: layout of proportional symbol maps. Given some accepted measures of the visual quality of a drawing, putting smaller disks on top of larger disks isn’t always the best approach.