Touring the Rio Olympics

I’m a sportswriter who is bound for the Olympics, and I’m writing an article about maximizing the number of events I see in a particular day.

I thought the input of a mathematician with expertise in these matters would be helpful to the story.

This was an interesting start to day a month ago.  I received this email from New York Times reporter Victor Mather via University of Waterloo prof Bill Cook.  Victor had contacted Bill since Bill is the world’s foremost expert on the Traveling Salesman Problem (he has a must-read book aimed at the general public called In Pursuit of the Traveling Salesman: Mathematics at the Limits of Computation).  The TSP involves visiting a number of sites while traveling the minimum distance.  While Victor’s task will have some aspects of the TSP,  there are scheduling aspects that I work on so Bill recommended me (thanks Bill!).

Victor’s plan was to visit as many Olympic events in Rio as he could in a single day.  This was part of a competition with another reporter, Sarah Lyall.  Victor decided to optimize his day; Sarah would simply go where her heart took her.  Who would see more events?

Victor initially just wanted to talk about how optimization would work (or at least he made it seem so) but I knew from the first moment that I would be optimizing his day if he would let me.  He let me.  He agreed to get me data, and I would formulate and run a model that would find his best schedule.

On the day they chose (Monday, August 15), there were 20 events being held.  rio-2016
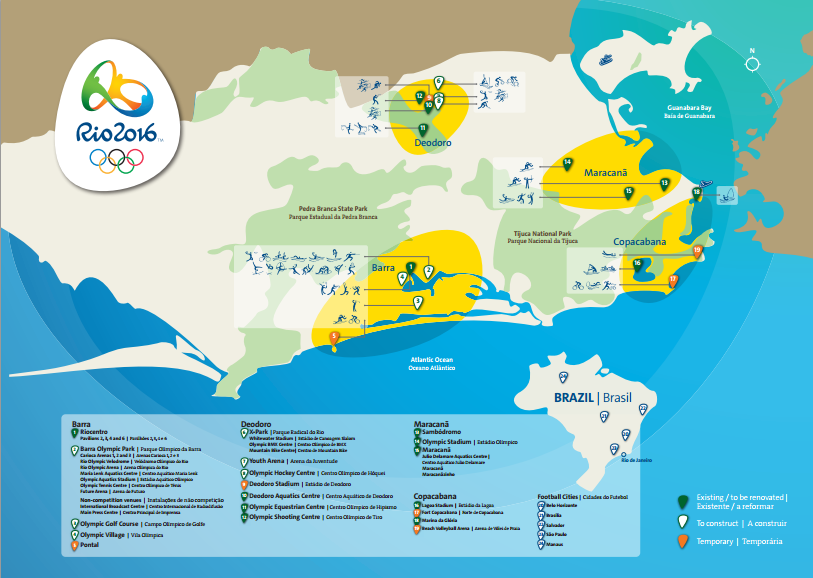
The map shows that the venues are all spread out across Rio (a dense, somewhat chaotic, city not known for its transportation infrastructure).  So we would have to worry about travel distance.  Victor provided an initial distance matrix, with times in minutes (OLY times).  As we will see, this matrix must have been created by someone who had a few too many caipirinhas on Copacabana Beach:  it did not exactly match reality.

So far the problem does look like a TSP: just minimize the distance to see 20 sites.  The TSP on 20 sites is pretty trivial (see a previous blog post for how hard solving TSPs are in practice) so simply seeing the sites would be quite straightforward.  However, not surprisingly Victor actually wanted to see the events happening.  For that, we needed a schedule of the events, which Victor promptly provided:

Badminton 8:30 am – 10:30 am // 5:30 pm -7
Basketball 2:15 pm – 4:15 pm// 7 pm -9 pm // 10:30 pm – midnite
Beach Volleyball 4 p.m.-6 p.m. // 11pm – 1 am
Boxing 11 am-1:30 pm, 5 pm – 7:30 pm
Canoeing 9 am – 10:30 am
Cycling: 10 a.m. – 11 am /// 4 pm – 5:30
Diving 3:15 pm -4:30
Equestrian 10 am- 11 am
Field Hockey 10 am – 11:30 am // 12:30 –2 // 6-7:30 pm // 8:30 pm -10
Gymnastics 2 pm -3 pm
Handball: 9:30 am- 11 am// 11:30 – 1pm //2:40 -4 //4:40 – 6 pm // 7:50 – 9:10 pm // 9:50 pm -11:10
Open water Swimming 9 am – 10 am
Sailing 1 pm – 2 pm
Synchronized swimming: 11 am- 12:30
Table tennis 10 am -11 am // 3pm -4:30 // 7:30pm – 9
Track 9:30 am -11:30 am // 8:15pm -10 pm
Volleyball 9:30 am- 10:30 am // 11:30 – 12:30 // 3pm – 4 pm // 5 pm – 6 pm // 8:30 pm -9:30 // 1030 pm -11:30
Water polo 2:10 pm – 3 pm // 3:30 -4:20 //6:20 -7:10 // 7:40 – 8:30
Weightlifting 3:30 – 4:30 pm // 7 pm- 8 pm
Wrestling 10 am – noon // 4 pm- 6 pm

Many events have multiple sessions:  Victor only had to see one session at each event, and decided that staying for 15 minutes was enough to declare that he had “seen” the event.  It is these “time windows” that make the problem hard(er).

With the data, I promptly sat down and modeled the problem as an mixed-integer program.  I had variables for the order in which the events were seen, the time of arrival at each event, and the session seen for each event (the first, second, third or so on).  There were constraints to force the result to be a path through the sites (we didn’t worry about where Victor started or ended: travel to and from his hotel was not a concern) and constraints to ensure that when he showed up at an event, there was sufficient time for him to see the event before moving on.

The objective was primarily to see as many events as possible.   With this data, it is possible to see all 20 events.  At this point, if you would like to see the value of optimization, you might give it a try:  can you see all 20 events just by looking at the data?  I can’t!

But there may be many ways to see all the events.  So, secondarily, I had the optimization system minimize the distance traveled.  The hope was that spending less time on the buses between events would result in a more robust schedule.

I put my model in the amazing modeling system AIMMS.  AIMMS lets me input data, variables, constraints, and objectives incredibly quickly and intuitively, so I was able to get a working system together in a couple of hours (most of which was just mucking about with the data).  AIMMS then generates the integer program which is sent to Gurobi software (very fast effective mixed-integer programming solution software) and an hour later I had a schedule.

start Arrival Next travel time
canoe 9:00 20
open swimming 9:35 45
equestrian 10:35 35
wrestling 11:25 10
synchro 12:15 30
sailing 13:00 30
gymnastics 14:00 10
handball 14:40 10
basketball 15:05 10
diving 15:30 10
cycling 17:00 30
beach volleyball 17:45 30
badminton 18:40 5
boxing 19:00 5
weightlifting 19:20 5
table tennis 19:40 10
water polo 20:05 35
hockey 20:55 35
track 21:45 20
volley 22:30
end 22:45

This schedule has 385 minutes on the bus.

I discussed this problem with my colleague Willem van Hoeve, who spent about five minutes implementing a constraint programming model (also in AIMMS) to confirm this schedule.  He had a access to a newer version of the software, which could find and prove optimality within minutes.  Unfortunately my version of the software could not prove optimality overnight, so I kept with my MIP model through the rest of the process (while feeling I was driving a Model T, while a F1 racecar was sitting just up the hallway).  CP looks to be the right way to go about this problem.

I spent some time playing around with these models to see whether I could get something that would provide Victor with more flexibility.  For instance, could he stay for 20 minutes at each venue?  No: the schedule is too tight for that.  So that was the planned schedule.

But then Victor got to Rio and realized that the planned transportation times were ludicrously off.  There was no way he could make some of those trips in the time planned.  So he provided another transportation time matrix (olympics3) with longer times.  Unfortunately, with the new times, he could not plan for all 20: the best solution only allows for seeing 19 events.

Event Arrival Next Travel Slack
canoe 9:00 30
track 9:45 45
equestrian 10:45 35
synchro 11:35 60 0:10
sailing 13:00 60
gymnastics 14:15 15
water polo 14:45 15
diving 15:15 15 0:25
cycling 16:10 15
handball 16:40 15
wrestling 17:10 25
boxing 17:50 15
badminton 18:20 15 0:10
weightlifting 19:00 15 0:35
table tennis 20:05 25
basketball 20:45 35 0:10
hockey 21:45 45 0:30
volley 23:15 30
beach volleyball 0:00

So that is the schedule Vincent started with.  I certainly had some worries.  Foremost was the travel uncertainty.  Trying to minimize time on the bus is a good start, but we did not handle uncertainty as deeply as we could have.  But more handling of uncertainty would have led to a more complicated set of rules and it seemed that a single schedule would be more in keeping with the challenge.  The morning in particularly looked risky, so I suggested that Victor be certain to get to gymnastics no later than 2:15 in order to take advantage of the long stretch of close events that follow.  Sailing in particular, looked to be pretty risky to try to get to.

I had other worries:  for instance, what if Victor arrived during half-time of an event, or between two games in a single session?  Victor probably wouldn’t count that as seeing the event, but I did not have the detailed data (nor an idea of the accuracy of such data if it did exist), so we had to hope for the best.  I did suggest to Victor that he try to keep to the ordering, leaving an event as soon as 15 minutes are up, hoping to get a bit more slack when travel times worked out better than planned (as-if!).

So what happened?  Victor’s full story is here and it makes great reading (my school’s PR guy says Victor is “both a reporter and a writer”, which is high praise).  Suffice it to say, things didn’t go according to plan. The article starts out:

There are 20 [events] on the schedule on Monday.  Might an intrepid reporter get to all of them in one day?  I decide to find out, although it doesn’t take long to discover just how difficult that will be.

The realization comes while I am stranded at a bus stop in Copacabana, two and a half hours into my journey.  The next bus isn’t scheduled for three hours.  And I’ve managed to get to exactly one event, which I could barely see.

I had given him some rather useless advice in this situation:

“Something goes wrong, you reoptimize,” Professor Trick had cheerfully said.  This is hard to do sitting on a bus with the computing power of a pen and a pad at my disposal.

Fortunately, he got back in time for the magical sequence of events in the afternoon and early evening.  One of my worries did happen, but Victor agilely handled the situation:

Professor Trick urged me in his instructions to “keep the order!”  So it is with some trepidation that I go off-program.  Wrestling is closer to where I am than handball, and it looks like I will land at the handball arena between games.  So I switch them.  It’s the ultimate battle of man and machine — and it pays off.  I hope the professor approves of my use of this seat-of-the-pants exchange heuristic.

I do approve, and I very much like the accurate use of the phrase “exchange heuristic”.

At the end Victor sees 14 events.  19 was probably impossible, but a few more might have been seen with better data.  I wish I had used the optimization code to give Victor some more “what-ifs”, and perhaps some better visualizations so his “pen and pad optimization” might have worked out better.  But I am amazed he was able to see this many in one day!

And what happened to Sarah, the reporter who would just go as she pleased?  Check out her report, where she saw five events.  If Victor went a little extreme getting a university professor to plan his day, Sarah went a little extreme the other way in not even looking at a map or a schedule.

This was a lot of fun, and I am extremely grateful to Victor for letting me do this with him (and to Bill for recommending me, and to Willem for providing the CP model that gave me confidence in what I was doing).

I’ll be ready for Tokyo 2020!

Russia really owned this podium

Back in 2010, Canada’s  goal was to “own the podium” at the Winter Olympics.  What “owning the podium” meant was open to interpretation.  Some argued for “most gold medals”; others opted for “most overall medals”; still others had point values for the different types of medals.  Some argued for normalizing by population (which was won, for London 2012, by Grenada with one medal and a population of 110,821, trailed by Jamaica, Trididad and Tobago, New Zealand, Bahamas, and Slovenia) (*). Others think the whole issue is silly: people win medals, not countries.  But still, each Olympics, the question remains: Who won the podium?

I suggested dividing the podium by the fraction of “reasonable” medal weightings that lead to a win by each country.  A “reasonable” weighting is one that treats gold at least as valuable as silver; silver at least as valuable as gold; no medal as a negative weight; and with total weighting of 1.  By that measure, in Vancouver 2010, the US won with 54.75% of the podium compared to Canada’s 45.25%.  In London 2012, the US owned the entire podium.

The Sochi Olympics have just finished and the result is…. Russia in a rout.  Here are the medal standings:


2014medals

Since Russia has more Gold medals than anyone else plus more “Gold+Silver” plus more overall, there are no reasonable weightings for gold, silver, and bronze that result in anyone but the Russian Federation from winning.

Nonetheless, I think Canada will take golds in Mens and Womens hockey along with Mens and Womens curling (among others) and declare this a successful Olympics.

———————————————————————————

(*)  I note that some sports limit the number of entries by each country, giving a disadvantage to larger countries for population based rankings (there is only one US hockey team, for instance but Lithuania also gets just one).

Scheduling Major League Baseball

ESPN has a new “30 for 30” short video on the scheduling of Major League Baseball.  In the video, they outline the story of Henry and Holly Stephenson who provided Major League Baseball with its schedule for twenty-five years.  They were eventually supplanted by some people with a computer program.  Those people are Doug Bureman, George Nemhauser, Kelly Easton, and me, doing business as “Sports Scheduling Group”.

It was fascinating to hear the story of the Stephensons, and a little heart-breaking to hear them finally losing a job they obviously loved.  I have never met Henry or Holly, and they have no reason to think good thoughts about me.  But I think an awful lot of them.

I began working on baseball scheduling in 1994, and it took ten years of hard work (first Doug and me, then the four of us) before MLB selected our schedule for play.

Why were we successful in 2004 and not in 1994? At the core, technology changed. The computers we used in 2004 were 1000 times faster than the 1994 computers. And the underlying optimization software was at least 1000 times faster. So technology made us at least one million times faster. And that made all the difference. Since then, computers and algorithms have made us 1000 times faster still.  And, in addition, we learned quite a bit about how to best do complicated sports scheduling problems.

Another way to see this is that in 1994, despite my doctorate and my experience and my techniques, I was 1 millionth of the scheduler that the Stephensons were. Henry and Holly Stephenson are truly scheduling savants, able to see patterns that no other human can see. But eventually technological advances overtook them.

More recently, those advances allowed us to provide the 2013 schedule with interleague play in every time slot (due to the odd number of teams in each league), something not attempted before. I am confident that we are now uniquely placed to provide such intricate schedules. But that does not take away from my admiration of the Stephensons: I am in awe of what they could do.


The Pirates have not clinched a non-losing season

nl_standingsThe newspapers here are full of news that the Pittsburgh Pirates (Major League Baseball) have broken a twenty-year reign of mediocrity by guaranteeing a non-losing season.  Since they have won 81 games in a 162 game season, that seems self-evident.

But those of us in operations research know enough to check out the details before leaping to a conclusion.  Consider the following situation:

1) The Pirates proceed to lose all their remaining games to end up at 81-81.

2) St. Louis and Cincinnati pass the Pirates, to win the division and the first wild-card.

3) Arizona ends up at 81-81 also, with all other teams (except division winners) with a worse record.

The Pirates would then play Arizona a one-game tie-breaker to determine who the second wild-card team is.  Suppose (horrors!) they lose again.  Where does the game count?  It turns out that tie-breaking  games count in the regular season records, as Wikipedia confirms.  So Pittsburgh would end up 81-82, for another losing season.  Note that it has to be a one-game tie-breaker:  subsequent playoff games are not included in regular season records.

I don’t think anyone is losing sleep over this possibility.  But a correct computer system for determining clinching of non-losing seasons would have to take this into account.   Having worked on such a system for another professional sports league, I can assure you that all the difficulty is in these near (but not quite) impossible events.  99% of the code handles cases that have never occurred, and are unlikely to occur in our lifetimes.

Note that if Pittsburgh wins one more game, then they are guaranteed a winning season:  a tie-breaker can’t turn their record into a losing (or .500) season.

Update 9/9: With the win tonight, the Pirates guarantee a winning season.  Now the streak is truly broken!  Go Bucs!


The Golden Ticket

The Golden Ticket

I picked up Lance Fortnow’s new book The Golden Ticket: P, NP and the Search for the Impossible.  Lance is chair of the School of Computer Science at my alma mater Georgia Tech (I got my PhD there in Industrial Engineering) and the co-author of the excellent Computational Complexity blog.

The title of the book comes from the Willy Wonka story of finding a golden ticket that allows passage into a chocolate factory and a lifetime supply of candy.  But golden tickets are rare:  how can one find one?  Can finding golden tickets be done fast?  The difficulty of finding rare items in a sea of possibilities is at the heart of the P=NP issue.

After a brief introduction to the sort of problems that are in NP (problems whose solution can be checked quickly, with some being in P, problems whose solution can be found quickly), Lance moves on to an extended fantasy of what would happen if a proof of P=NP (in other words: problems whose solutions can be checked quickly can also have their solutions found quickly) were to be discovered.  An initial proof leads to inefficient (but polynomial) codes which are used to improve on themselves culminating in the “Urbana algorithm”  (I bet it would be the “Carnegie Algorithm”, but this is Lance’s story):

… 42 million lines of unintelligible code.  And it solved NP problems fast, very fast. [without becoming self-aware.  No Skynet in this book.]

Lance then explores the effect of the Urbana algorithm.    Some of his predictions seem a bit far-fetched.  I don’t think the difficulty in predicting snow storms a year in advance (as he suggests will happen) is an issue of algorithm speed, but rather limits on data availability and modeling limits, but, again, this is Lance’s fantasy so I really shouldn’t quibble.

One of Lance’s stories has a father and daughter going to a baseball game, and the father muses on the effect the Urbana algorithm has had on baseball:

First, of course, is the schedule of this particular game.  As late as 2004, a husband-and-wife team, Henry and Holly Stephenson, scheduled games for Major League Baseball.  They used a few simple rules, like the number of games played at home and away by each team, and some local quirks, like the Boston Red Sox like to host a daytime baseball game on Patriot’s Day in mid-April, as the runners in the Boston Marathon pass nearby [a story that takes on a whole different flavor now].  In 2005, Major League Baseball contracted with a Pittsburgh company, the Sports Scheduling Group, because its scheduling could better avoid teams playing each other in consecutive weeks.

Hey, that’s me!  I made it into Lance’s book!  Well, me and my colleagues at the Sports Scheduling Group.  Lance goes on to say a few more words about the effect of the Urbana algorithm on scheduling:

So the baseball czars want to schedule games in a way that everyone has the best possible weather and good teams play each other at the end of the season, not to mention more mundane cost savings like reducing the amount of travel for each team.  Handling all these issues and the multitude of possible schedules would have been impossible a mere fifteen years ago [the story is based in 2026], but the Urban algorithm spits out the best schedule in  a matter of minutes.

If I were to continue the story, I would include something Lance did not:  the Sports Scheduling Group would likely have gone out of business shortly after the release of the Urbana algorithm.  While part of our skill is understanding sports leagues, a big part of our competitive advantage is that we can solve sports scheduling problems pretty darn quickly, despite the fact they are all NP-complete (the hardest of the NP problems).  In short, while a proof of P=NP might be a golden ticket for some, our golden ticket is is the difficulty caused by P <> NP.  In Warren Buffet’s terms, computational complexity is our business’s moat, preventing others from following too easily.

So far, I love the book (and not just because of the shout-out!).  It is a book on a technical subject aimed at a general audience.  I’m only partway through (I am kinda stuck on showing the baseball story to those around me), but Lance’s mix of technical accuracy with evocative story telling works for me so far.


Operations Research and a Baseball Job

Analytics is getting to be more and more important in sports, and sports teams and leagues are looking to people with analytical skills to fill key roles in their organizations.   The MIT Sports Analytics conference is a big deal, attracting more than 2000 attendees, with an active job placement service.  The MBAs at my own school (the Tepper School) now has a sports analytics club, with a speaker series, case competition and more (including fun things like fantasy sports competitions) and many of these exceptionally bright and ambitious students are eager for jobs in the sports industry.  While some of this may be due to the success of Moneyball, much more of this is due to the fact that computers and decision making have gotten much, much better in the last years, making analytics a key competitive advantage.  And when you get past dashboards and basic data analysis and visualization, you move into using data to make better decisions.  In other words, you move into operations research.

It is clear that many clubs in Major League Baseball get it.  I see it when talking to people with my local team, the Pittsburgh Pirates (a team that I am sure will break .500 any year now!), and I just got a job announcement that shows that the next closest team to me, the Cleveland Indians, get it too.  They are looking for a VP-Technology, but it is clear that they see this as a job involving decision making, not just infrastructure.  From the ad, the primary purpose is:

The Vice President of Technology is responsible for developing, implementing, measuring and maintaining
plans that advance the organization’s achievement of its guiding commitments through enhanced
Baseball Operations and business decision-making tools, increased effectiveness of systems, hardware,
technology infrastructure and improved fan experience through fan-centric technology implementations.

I love the “decision-making tools” in that description.  Sounds just right for an operations research person who also understands technology.


Owning the Podium: Summer 2012 edition

During the last winter Olympics, I had what I thought was a pretty good idea.  There are many ways to rank countries during the Olympics:  you can rank them by total number of medals, or you can rank them by number of gold medals, or by some point scheme (5 for gold, 3 for silver, 1 for bronze) and so on.  Point schemes seem to make sense, but then people argue about points.  Is a gold worth 5 bronzes or 4? Is 2 silvers more than, less than, or the same as a gold?

So my idea was to rank countries by the fraction of reasonable weights that result in them having the highest point count.  Not every point scheme is reasonable:  only a bronze lover (pyropusaphile?) would score bronze higher than gold.  So we need gold >= silver >= bronze.  And it seems unreasonable to have a negative weight on a medal.  Finally, the weights can be scaled so that the total weight is one.

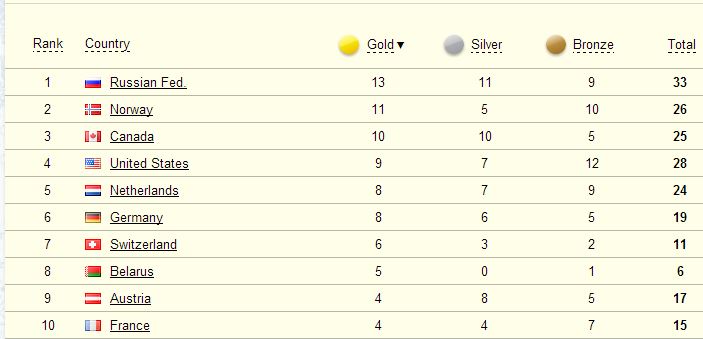
In the Winter 2010 Olympics, Canada was edged out by the United States in the Trick Medal Championship (TMC) by a narrow margin.  Canada had 14 gold, 7 silver, and 5 bronze;  the US went 9, 15, 13.  If you put enough weight on gold, then Canada wins.  But only 45.25% of the reasonable weights put enough weight on Gold for Canada to win;  the US wins for the remaining 54.75% of the weights.

The summer Olympics are now over, with the final medal count being:

US: 46,29,29

China: 38,27,22

Russia: 24,25,33

Great Britain: 29, 17,19

with no other country winning at least 20 medals of a single type.

So the coveted TMC Award goes to …. the United States in a rout!  In fact, the US wins for every reasonable weighting.  Russia could win with a lot of weight on bronze medals, but not if the weight on gold and silver is at least that of bronze.

A necessary and sufficient condition to win for any reasonable weight is to have

  1. more gold than anyone else,
  2. more gold+silver than anyone else, and
  3. more gold+silver+bronze than anyone else.

Equality in any of these can lead to weights where the country ties for the win.

Here, the US meets that condition.  Of course, it helps that there are a zillion medals in swimming (where the US does well) and only one in, say, team handball (described here as water polo without the water, which is only marginally informative).  But a win is a win:  if any representative of the US Olympic teams would like to drop by my office, I will be glad to give them the TMC trophy (which I will be recycling from my stash of high-school curling trophies I have dragged around the world).

P.S. The Wall Street Journal Numbers Guy has a similar discussion though, sadly, it does not include the above approach.

Sports with a vague Operations Research connection

It is pretty clear that academic administration and blogging are perfect substitutes, at least in regard to time, if not satisfaction.  After having an easy period earlier in the year when I racked up a dozen blog posts, administrative needs sucked up all my time, leading to the buildup of dust-bunnies at Ye Olde Blog.  But it is the end of term, so perhaps I can get things cleaned out.

Let me point out two recent sports-oriented items.  First is a fascinating dynamic map from Slate showing the winning of sports championships in the four major US sports (football, baseball, hockey, and basketball).  The progression is fascinating, and the graphical display gives far more information than the static listing does.  It is a great example of the value of visualization, even if I can’t quite figure out what the value is.  The graphic to the left shows a particularly good year:  1979 when Pittsburgh really was “The City of Champions”.

Second, there were two good articles on sports scheduling.  The first was on NFL scheduling in the New York Times.  Lots of people sent me this, since I’m part of the group that does Major League Baseball Scheduling.  The article does a great job of talking about all difficulties there are in agreeing on a schedule. Ironically, some of these difficulties come from the ease at which it is possible to get NFL schedules.  When it is possible to ask “What if we had Pittsburgh play New England in week 3?” and get back appropriate schedules quickly, it is tempting to ask a near-endless set of questions.  Particularly when there are many interested parties and no particular rules for aggregating preferences.

Baseball scheduling doesn’t provide the same quick response.  Due partially to the size of the schedule (2430 games or 780 series rather than the NFL’s 256 games) but due mainly to the scheduling difficulty of “good trips” (an issue of minimal importance to the NFL since teams return home after almost every game), the turn-around time on MLB schedules is measured in days or weeks, not minutes or hours.  Which brings me to the second article:  an article in the LA Times on baseball scheduling.  It even quotes my partner Doug Bureman:

Bureman, whose company also does the scheduling for several major-college conferences, summed up the job this way:

“We’re kind of in the business of seeking perfection, knowing that you’re never going to get there.”

That is for sure:  we are a long way from perfection!  But this year has been fascinating due to realignment issues:

All of this gets even more jumbled in 2013 when MLB realigns, with the Houston Astros moving to the American League and both leagues having 15 teams. (Currently there are 16 in the NL, 14 in the AL.) Interleague games will then be spread through the season instead of being bunched together around midseason as they are now.

Feeney and her group are currently working on that 2013 schedule, and have found it to be quite a challenge. “We’re still struggling with the format,” she said.

For a sports scheduler, this “struggle” is a once-in-a-lifetime opportunity, and it has been tremendously fun and interesting to work out how that format might work.

In between bouts of academic administration!


Benchmarks: Coloring, Sports and Umpires

I have always felt strongly that operations research needs more libraries of instances for various problem classes, along with listings of current best solutions.  By tracking how well we solve problems over time, we can show how we advance as a field.  It also makes it easier to evaluate new work, making both authors and referees work easier.

I began this direction almost two decades ago when I spent a year at DIMACS (a fantastic research institute on discrete mathematics and computer science based at Rutgers) when I (together with David Johnson) ran their Computational Challenge, with an emphasis on solving graph coloring, clique, and satisfiability instances.  From that, I put together a page on graph coloring (which has to be one of the oldest pages on the internets!)   David, Anuj Mehrotra and I followed that up in 2003 with an updated challenge just on graph coloring.   It was great to see people re-use the same instances, so we could understand the advances in the field.  It is hard to tell exactly how many papers have used the various benchmark repositories, but it is clearly the basis for hundreds of papers, based on google scholar hits on the DIMACS paper referencing the instances.

I had this experience in mind ten years ago when Kelly Easton, George Nemhauser and I wanted to publish about work we had done with Major League Baseball in their scheduling.  It made no sense to use MLB as a benchmark, since there is only one instance per year and much of the information about the needs of a schedule is confidential.  So we created the Traveling Tournament Problem that abstracts two key issues in MLB scheduling: travel distance, and “flow” (the need to mix home and away games).  We created a set of instances, solving a few smaller ones, and let it loose on the world.  The result was fantastic:  dozens of groups started working on the problem, and we could clearly see which techniques worked and which didn’t.

I had made a terrible mistake when creating benchmarks for graph coloring.  I didn’t keep track of best results.  This led to a fair amount of chaos in the field, with contradictory results appearing (claimed coloring values better than claimed lower bounds), and no clear picture of where things are going.  I had thought at one time that I would try to clean things up with a “Repository of Optimization Instances and Solutions”, but too many other things have intruded for me to spend the time necessary on that.  Fortunately, Stefano Gualandi and Marco Chiarandini have put together a site for graph coloring solutions, and I hope they will be successful in their efforts to put a little structure in the field.

I learned from that mistake and was much more diligent about keeping track of solutions for the Traveling Tournament Problem.  The TTP site is always up to date (OK, almost always), so people can reasonably trust the results there.  I have recently extended the site to include instances for non-round-robin scheduling and for the Relaxed TTP (where there is an opportunity for off-days).

One relatively new problem I am excited about is scheduling umpires in sports.  Former doctoral students Hakan Yildiz (now at Michigan State) and Tallys Yunes (Miami) and I developed a problem called the Traveling Umpire Problem which again tried to abstract out key issues in Major League Baseball scheduling.  In this case, the umpires want to travel relatively short distances (unlike the players, the umpires have no “home city”, so they are always traveling) but should not see the same teams too often.  This problem feels easier than the Traveling Tournament Problem, but we still cannot solve instances with 14 or more umpires to optimality.  This work received a fair amount of interest when the university PR people caught hold of our Interfaces paper.  Since that paper, Hakan and I have put together a couple of other papers, exploring optimization-based genetic algorithms and benders-based local search approaches for this problem (to appear in Naval Research Logistics).  Both papers illustrate nice ways of using optimization together with heuristic approaches.  The website for the problem gives more information on the problem, along with instances and our best solutions.

I don’t think my repositories of benchmarks will be as influential as, say MIPLIB, which focuses on mixed integer programs.  But I do like to think that they make the operations research world run a bit smoother.

Operations Research: The Sort of Decisions That Will Get You Fired

I just saw an ad for “Moneyball”, a new movie based on the book by Michael Lewis. A baseball manager (Billy Beane of the Oakland Athletics) used analytics (“Sabremetrics” in the baseball world) to choose players who were undervalued by the rest of the baseball world.  Beane had a constrained optimization problem:  he had to get as many wins as possible with a highly binding budget constraint.  His solution to that problem was to concentrate on statistics that seemed to be undervalued in the market, notably “on base percentage” (if you don’t know baseball, this gets a bit opaque, but getting on base is not as “sexy” as hitting home runs:  home run hitters are expensive; players that just get on base were cheap at the time).

There is a great line in the ad.  A colleague (the “stats guy”) of Beane says:

This is the type of decision that will get you fired!

Brad Pitt, playing Beane,  looks worried, but perseveres.  See the ad at about 25 seconds the official ad at about 18 seconds.

[Unofficial ad deleted.]

I love that line, since it really does sum up what operations research (and make no mistake: “Moneyball” is an operations research film) is all about. When you do operations research, you create models of reality. You do not create models of decisions. The decisions come from the models. And sometimes, the decisions don’t look at all like what you expected. And that is when it gets interesting.

Sometimes these unexpected decisions are due to modeling failures: you have forgotten a constraint, or a key modeling assumption turns out to not only be incorrect (assumptions almost always have some level of incorrectness) but critically incorrect. Optimization is really good at putting solutions right where the models are the weakest. And so you modify the model, not in order to change the decision, but in order to better represent reality. And you get new decisions. And you iterate between modeling and decisions until you reach a model that you believe represents reality. At that point, the decisions are of two types. They might tell you to do what you are doing, but do it better. And that is comforting and probably improves the decision making in the organization.

Or they tell you to do something completely different. And that is when you get to “Decisions that might get you fired.” That is when you need to decide whether you believe in your model and believe in the decisions it has generated. It would certainly be easy to change the model, not to reflect reality, but to force the decisions you believe are right. But if you really believe the model, then you need to avoid that easy path. You really need to decide whether you believe in the model and the resulting decisions.

I worked with a company a few years ago on their supply chain design. The results of the model came back over and over again saying two things: there were too many distribution centers, a result everyone believed, and it was far better for each distribution center to specialize in particular products, rather than have every center handle every product. The latter decision went deeply against the grain of the organization, and objection after objection was raised against the model. It would have been easy to put in a constraint “Every distribution center has to handle every product”. But there was no justification for this constraint except the ingrained belief of the client. In fact, we could show that adding the constraint was costing the organization a significant amount of money. Eventually, at least some of the organization bought into the decisions and began devising specialized distribution centers, but it was gut-wrenching, and perhaps career threatening. After all the discussion and fighting against the decisions, I am convinced those were the right choices: the organization had to change, not just improve.

“Operations Research: The Sort of Decisions That Will Get You Fired” doesn’t have the ring of “The Science of Better”. But the insights OR can get you may lead to radically different solutions than the incremental changes the SoB campaign implied. And those are the changes that can fundamentally change firms and organizations. And careers.