How Operations Research Helps Me Understand Politics and Voting

Over the years, operations research, politics, and voting have intersected often for me. Going back almost 25 years now, I have done research on voting systems. I have blogged on elections, and written about predicting results and presenting results. I have written about political leaders who were trained in operations research, and even countries run on O.R. principles.

Over time, I have been both elated and disillusioned by politics at both the national and local scale. I use what I know about elections when I run committees, and get very frustrated by others running committees without an understanding of the basics of voting theory.

While I will not claim to be an expert on how theory and practice interact in politics and elections, I do have some insights. Many of these are well known to those in voting theory, but some are a little idiosyncratic. Perhaps we can have an election afterward on which is the most useful.

  1. When there are more than two possibilities, Plurality voting is just plain wrong. Plurality voting is what many of us (particularly here in the U.S.) think of as “normal” voting: everyone votes for their favorite and whichever alternative gets the most votes wins. We use this system a lot, and we should essentially never use it. The difficulties it causes with vote-splitting and manipulation are ridiculous. It is plurality voting that causes Republicans to support a left-wing candidate in the U.S. Presidential election (and vice versa for Democrats and a right-wing third party): if the third candidate takes votes away from the Democrat then the Republican has a better chance of winning.I feel strongly enough about this that I cannot be on a committee that uses Plurality voting: I will simply argue about the voting system until it changes (or until they start “forgetting” to tell me about meetings, which is kinda a win-win).
  2. I can live with practically any other voting system. There are quasi-religious arguments about voting systems with zealots claiming one is far superior than all the others. Nothing has convinced me: the cases where these voting systems differ are exactly the cases where it is unclear to me who should be the winner. So whether it is approval voting (like INFORMS uses), or some sort of point system (“Everyone gets six votes to divide among the candidates”), or multi-round systems (“Divide three votes, then we’ll drop the low vote getter and revote”) or whatever, most of it works for me.
  3. The person setting the agenda can have a huge amount of power. While I may be happy with lots of systems, I am hyper-aware of attempts to manipulate the process. Once you give people the chance to think about things, then the agenda-setter (or voting-rule setter) can have an undue amount of power. Of course, if I am the agenda-setter, then knowing lots of voting rules can be quite helpful. Even without knowing committee preferences, it is handy to know that the following rule can help A win in an election with A, B, and C.

    Let’s do B against C then the winner against A.

    That is pretty obviously to A’s advantage (with voters voting their true preferences, A will win unless one of the others is a Condorcet winner — a candidate who could beat every other candidate in a two-person election). Less obvious is

    Let’s do A against B, then A against C, then the winners against each other

    This seems to favor A, but it does not. The only way A can win this election (with truthful voters) is for A to beat both B and C (hence be the Condorcet winner).
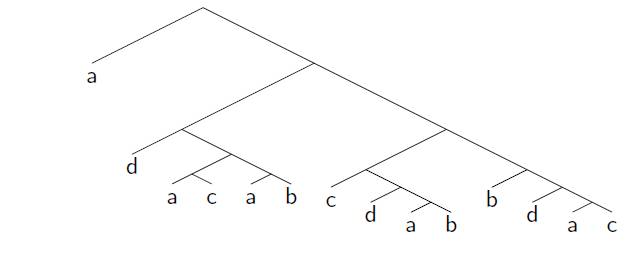
    In fact, my research shows that you can arrange for A to win in a four-candidate election no matter what the preferences are provided A is not the Condorcet loser (loses to every other candidate in a pairwise election) and no other candidate is a Condorcet winner. Unfortunately, no committee is willing to sit still for the 12 votes required, beginning

    We’ll go with A against B, then A against C, then take the winners against each other, and take the winner of that against D, then…

    This leads to my favorite voting tree, as in the diagram.

  4. When there is block voting, power is only weakly related to the size of the block. I have in mind systems where different “voters” have different numbers of votes. So, in a parliamentary system with party-line voting, if there are 40 representatives for party A, then party A gets 40 votes. It might seem that if the overall support is 40% for party A, 40% for party B, and 20% for party C, then it would only be fair to give parliamentary seats in that proportion. Unfortunately, if bills need 50% of the vote to pass, “proportional representation” gives undue power to party C. In fact, in this case C has as much power as A or B: two of the three parties are needed to pass any bill. Conversely, if the support is 51%, 48%, 1%, and a 50% rule is used to pass, then the first party has all the power.

    This simple observation has helped me understand the various issues with the recent U.S. Senate vis-a-vis the filibuster rules (which essentially required 60% of the votes to move anything of substance forward): the Senate vacillated between having the Democrats having all the power (51 votes to pass a bill) and having Democrats and Republicans having the same power (60 votes to end a filibuster). With no solution representing reality (either 58% of the Senate seats for the Democrats or perhaps a lower number representing nation-wide party support), the system cannot equate power with support.

    This is seen even more starkly in the election of a single individual like the U.S. President. George Bush in 2004 claimed a “mandate” after winning 51% of the popular vote. While 51% might not seem like a mandate, it is difficult how else to map 51% to a single person.

    Understanding this power relationship makes U.S. Electoral College analysis endlessly fascinating, without adding much insight into whether the Electoral College is a good idea or not.

  5. The push towards and away from the median voter explains a lot about party politics. One fundamental model in economics is the Hotelling Model.  Traditionally this model is explained in terms of ice cream vendors along a stretch of beach.  If there is one vendor, he can set up anywhere on the beach:  he has a monopoly, so no matter where the beach-goers are, they will go to the vendor.  But suppose there are more than one vendor and beach-goers go to the closest vendor. If there are two vendors, the only stable place for them to be (assuming some continuity in the placement of beach-goers) is to have both at the median point, right next to each other!  This seems counter-intuitive:  why aren’t they, say, 1/3 and 2/3 along the beach (for the case of uniformly distributed beach-goers)?  In that case, each vendor gets 1/2 of the customers, but the vendor at 1/3 would say “If I move to 1/2 then I’ll get 5/12 of the customers, which is more than my current 1/3”.  Of course, the vendor at 2/3 also has an incentive to move to the middle.  So they will happily set up next to each other, to the detriment of the beach-goers who must travel farther on average to satisfy their needs.

    How is this related to politics? I believe it gives the fundamental pressures on parties in two-party systems. In the U.S., both the Democrats and Republicans are pressed towards the middle in their efforts to get to the median voter. But the most interesting aspects are the ways in which the political system does not meet the modeling assumptions of the Hotelling model. Here are a couple:

    • The Hotelling Model assumes customers will purchase no matter what distance they need travel to the server. In a political model, voters sufficiently far away from all candidates may simply choose not to participate. While non-participation is often seen as abdicating a role, that need not be the case. Take the case of the “Tea Party Movement”. There are many interpretations of their role in politics, but one threat to the Republicans is a willingness to of the Tea Partiers to simply not participate. This has the effect, in a simplistic left-right spectrum model, to move the median voter to the left. If the Republicans want to move to the resulting median, they would have to hop over the Democrats, something that is simply infeasible (the effort to convince the left wing will take generations to believe the Republicans are really their party). So the threat of non-participation is a strong one, and can only be counteracted by the Republicans by having policies sufficiently appealing to the Tea Partiers to keep them participating. Of course, this rightward movement opens the opportunity for the Democrats to appeal to the crowd in the resulting gap between Democrats and Republicans, though the Democrats undoubtedly face non-participation threats at their own extremes.
    • Another sign of the pressures towards and away from the median occur in the primary/general election form of U.S. politics. During the primaries, a candidate (either local or national) needs to appeal to voters in their party (in most cases). This leads to movement towards the median of a party, particularly if there are only two candidates. Once the candidate has been chosen by the party, though, the candidate is now facing median pressure from the general population. this should result into a movement towards the center, which certainly seems to be the case. Party activists try to stop this move towards the center by forcing pledges or other commitments on candidates, which keep them more towards the median of their own party, perhaps at the expense of general election success.

    The Hotelling Model in politics is a wonderful model: it is wrong but useful. By understanding how the model doesn’t work, we can get insight into how politics does work.

It would be easy to be disillusioned about voting and politics based on theory (and practice, some days). No voting system is fair or nonmanipulable; pressures on candidates force them to espouse views that are not their own; consistency is obviously a foible of a weak mind.

Instead, my better understanding of voting and elections through operations research leaves me energized about voting. However imperfect it is, the system does not need to be mysterious. And a better understanding can lead to better systems.

This topic has been on my list of “to-do”s for a while. I am glad that the Second INFORMS Blog Challenge has gotten me to finally write it!
Don’t Forget to Vote!

If you are an INFORMS member (if you are interested in operations research, why aren’t you a member?), you should have received an email yesterday directing you to a website to vote for the next set of members of the Board of Directors.  That email has all the information you need to vote:  your member number and a code word.  You go to the website, enter those two numbers, get a form and spend a minute or two voting.  The candidate bios and platform statements are clickable from the ballot, so you don’t even have to research before hand (though if you want to, the candidate information is available).  A few points:

  • Your vote really does count.  The year before I got elected President, the Presidential vote resulted in a tie.  One extra vote either way would have prevented a run-off.
  • The candidates are chosen by a Nominating Committee (something the Past President chairs), though people can put themselves on the ballot by petition.  The latter used to happen more often:  it seems pretty rare these days.
  • INFORMS uses approval voting, where you can vote for as many candidates as you want for each position.  In many cases, I end up voting for all of the proposed candidates.  This is particularly true if I do not know the candidates, or I know them both equally well, and if I think they will do about equally well in positions.  Sometimes I have stronger feelings, so vote for one (or decidedly don’t vote for one!).  While it is equivalent in terms of the winner to vote for none as to vote for all, in terms of meeting quorum requirements, it is better to vote for all.  By the way, approval voting works much better when there are three or more candidates (or more than one position to be filled from the same set of candidates).  Approval voting to choose the winner between two candidates, as this election is, doesn’t add much (though I like the opportunity to vote for all or, rarely, none).
  • A number of candidates are running unopposed.  INFORMS allows its Vice Presidents to have two terms in a position.  Often, the nominating committee will decide to run someone up for reelection unopposed.  It doesn’t always happen, but it is the norm.
  • INFORMS does not announce number of votes in an election.  I was on the Board when that rule was created (and may even have formulated the rule).  The ideas was to not embarrass candidates who lose a blow-out election.  Now, I am not 100% convinced this is a good rule:  there is information in the votes (for instance, knowing the number who voted for none of the candidates versus those who voted for all).  Even the nominating committee does not know the number of votes, so, for instance, a candidate who came very close to winning might not get nominated again, while a candidate that the electorate soundly rejected might get renominated the next year.  Perhaps it is time for INFORMS to rethink this rule.

I sat on the INFORMS Board for six years, and am now completing six years on the IFORS Board.  Sitting on boards is generally interesting and rewarding (it is sometimes mind-numbingly dull, but I treat that as useful training in discipline).  I have met some really fascinating and wonderful people through the boards, and those contacts have been useful years after our terms ended.

We should be greatful that people are willing to give their time to boards like INFORMS.  If you are a member, now would be a good time to spend a couple minutes voting.

Presenting results and the election

In operations research, we often have problems presenting our results in a reasonably provocative yet accurate way.  I swear I have spent 10% of my life sitting through powerpoint tables with the presenter saying “Well, you can’t really see the numbers but they really show my approach is better” (and perhaps I spent a further 5% of the time presenting such slides:  I am as bad as many others in this respect).   We have to do better!

My adviser, John Bartholdi, is a big fan of Edward Tufte, to the extent that I can recognize my academic brothers by the Tufte in their bookshelves (I noted it for Kevin Gue at Auburn two weeks ago).  His main message is that thinking about how to present work can be as much effort or even more than the work itself.  But it pays off in improved understanding.

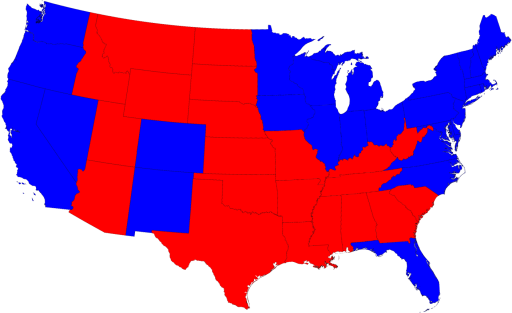
The recent US presidential election is a good example of a display challenge.  There is the simple data:  Barack Obama won the election and John McCain lost.  You can add in the “electoral college” numbers:  Obama with 364 to McCain’s 173 as I write, with one vote still too close to call in Nebraska.  But these numbers don’t give a very deep impression of the election.  Where did Obama do well?  Where did he do poorly?  The standard electoral map (like that shown at pollster.com) gives some impression (Obama blue on the coasts and around the great lakes, generally McCain red in the middle, but with some blue inroads in Colorado and New Mexico):

But this misses a huge amount also.  Some of these areas are highly populated, while some have very, very few people.  In the US, we don’t vote by acreage!

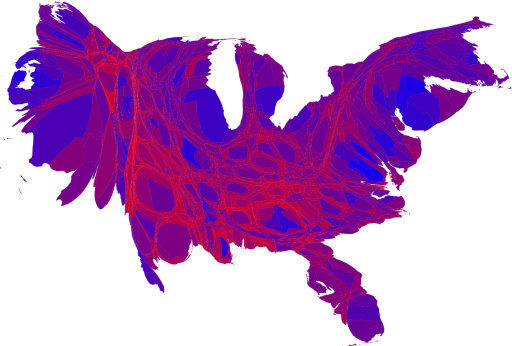
Mark Newman, a physicist and researcher in complex systems, has a great page on different presentations of the election.  The one I like best includes both a scaling of the states to keep their general shape but to scale them to be proportional to population and a mixing of blue and red (making purple) representing how strongly an area voted for Obama and McCain respectively:

I admit it looks a bit weird, resembling some cardiovascular system to my eyes, but Mark’s page walks us through the process.

The standard operations research talk would present this data in six-point fonts in a table that can’t be read by anyone more than 3 feet from the screen.  Perhaps when we get as good at presenting our work as the complex systems people seem to be, our field will get the respect it deserves.

Electoral College Power

There is an op-ed piece in today’s New York Times entitled “How Much is Your Vote Worth?” by Sarah Cowan, Stephen Doyle and Drew Heffron. Doyle and Heffron are graphic designers, which explains the lovely graphic:

Beautiful graphic, making it clear that the worth of a vote is far higher in smaller states. Unfortunately, the graphic (and the result) is completely misleading. The caption for the graphic is

This map shows each state re-sized in proportion to the relative influence of the individual voters who live there. The numbers indicate the total delegates to the Electoral College from each state, and how many eligible voters a single delegate from each state represents.

There is nothing wrong with the second part of this, but conflating “eligible voters a single delegate from each state represents” with “relative influence” ignores more than 40 years of research on the issue.

There are two issues to face. First, a voter in Wyoming can make a difference on only 3 electoral votes; a voter in California can affect 55 votes. Second, the need to get 270 votes to win the electoral college means a block of 55 votes has a different power than that of a block of 3. Dozens of papers have been written trying to work out the overall effect on the power of an individual voter. You can read more about this in Steven Brams “The Presidential Election Game”, a wonderful, if now dated, book (the 2007 does not appear to have updated much). A recent analysis is available at The Statistical Modeling, Causal Inference and Social Science blog, who also conclude that it is generally better to be in a small state, but not in the way illustrated by Cowan et al. (so, for instance, a DC voter has almost no influence, but an Ohio voter has high influence). Overall, depending on the assumptions you make, you will end up with different relative influences. But simply calculating the number of voters per electoral college delegate is grossly misleading.

Just to illustrate this, suppose there are only 2 states. State A has 10,000,000 voters for 2 Electoral College delegates; State B has 1 voter for 1 Electoral College delegate. The States (like all but 2 US States) are winner take all. Would you rather be in State A or State B? The corresponding graphic of Cowen et al. will show a voter in State B is hugely more “influential” than A, though only voters in state A have any influence at all in the election .

Nice graphic, but misleading analysis.

Minimum Democracy

A few weeks ago, I pointed out that Barack Obama (or John McCain) could win the upcoming Presidential Election with a tiny fraction of the popular vote.  I wrote:

It is possible to win the election for President of the United States with .00001% of the vote. For instance, suppose only one voter shows up in 49 states, and those voters vote for Obama, and 10,000,000 Republicans vote for McCain in New York, then Obama would lose the national popular vote 10,000,000 to 49 but he would have an overwhelming majority in the electoral college. While the results would never be that extreme, it is certainly possible (and has happened) to win the national popular vote and lose the electoral vote.

The current issue of OR/MS Today has a neat article by Winston Yang (University of Wisconsin-Stout) who takes the problem much more seriously.  Rather than allow my extreme variance in turnout, he works with population numbers (which is equivalent to assuming the same turnout rate in every state).  In this case, the minimum popular vote for a winner must be at least 22% or so.  This occurs when a candidate just wins enough states to get 270 electoral votes, and loses (completely) all other states.  Yang then analyzes a number of different ways of allocating electoral votes from the states.  For instance, Maine and Nebraska both use a system where there are electoral districts allocating all but two of the electoral votes, with the two electoral votes then be allocated to the candidate who wins the most popular votes.   Many political thinkers have proposed a number of approaches to allocating the electoral votes.  Yang has a nice graph illustrating the minimum fraction of votes necessary to win for the past elections:

Be sure to check out the full article at OR/MS Today!

More on Majority Judgement

Michel Balinski has provided the references related to his IFORS Distinguished Lecture in Washington.  I have included them in the original post. He also is encouraging people to try out the system themselves (he did this for INFORMS conference, but this is a more global experiment).  Here is the invitation:

Dear Friends and Colleagues,

This message is to invite you to participate in an electoral experiment.
Rida Laraki and I, members of the Ecole Polytechnique
and the CNRS, wish to test our new method of voting, “the majority
judgement,” in the context of the US presidential election.

A program has been developed by which anyone can vote via the net. We
guarantee that the votes cast are completely anonymous.

Please participate yourselves and encourage all  those whom you can
contact via the web, wherever they may be, to participate as well.

To participate simply enter into the following site:

Electoral Experiment : U.S. Elections 2008
<http://georgina.soluscience.fr:10000/XVote/index.php?sid=56263&lang=en>

Thank you for your help. Best wishes,

Cher(e)s ami(e)s et collègues

Rida Laraki et moi, membres du CNRS et de l’École
Polytechnique, expérimentons notre nouvelle méthode de vote, le jugement
majoritaire, dans le cadre des élections américaines.

Nous avons développé, avec l’aide de la direction de la recherche et de
l’innovation de l’École Polytechnique, un logiciel qui permet de voter d’une
manière très sécurisé via internet. Il est assuré que les votes sont
secrets.

Nous serions très heureux si vous pouviez y participer vous même à cet
expérience scientifique et si vous pouviez diffuser ce message autour de
vous, partout dans le monde.

Pour participer, il vous suffit de renter sur le site web suivant:

Electoral Experiment : U.S. Elections 2008
<http://georgina.soluscience.fr:10000/XVote/index.php?sid=56263&lang=en>

Cordialement,

Michel Balinski

Give it a try!

Another look at OR and US Presidential Elections

Mike Sheppard of Michigan State has a wonderful page that answers the question:  For each US Presidential Election, how few votes needed to change in order to reverse the result?  Most of us remember that in Bush-Gore 2000, just a few hundred Floridians needed to change their vote (269 by the official count:  I won’t get into the controversy on what the real number is (or even its sign!)) in order to give Florida to Gore who would then win the election.  But I hadn’t known that in 1976, Ford would have beaten Carter if just 9246 people (in Ohio and Hawaii) changed their vote!  The most one-sided election?  McGovern would have needed more than 3 million vote changes to beat Nixon in 1972.

Why is this operations research?  The question of which states need to switch is nicely modeled in integer programming, so this problem makes a nice (minor) modeling challenge.

You can also check out Mike’s use of linear programming to eat at McDonalds.

Tip of the hat to Greg Fulco for the pointer.

Operations Research and the US Presidential Election

I am in Cork, Ireland, attending the Irish Conference on Artificial Intelligence and Cognitive Science (I gave a talk on sports scheduling and three themes of modern integer programming: complicated variables, large scale local search, and logical Benders constraints). Conversation here (when an American is in the group: presumably without an American conversation is about hurling or something) is on the US Presidential Election. Some of the historical anomalies are a bit confusing. Why is it only now that Barack Obama “accepts” the nomination from the Democratic Party: shouldn’t he have decided on this long, long ago? What if he didn’t accept the nomination?

The most confusing aspect of the election process is our use of the Electoral College to elect the President. Rather than directly electing the President, voters vote for electors, with each state being given a set number of electors. For most states, all of the state’s electors are given over to just one candidate. This makes interpreting the polls quite difficult. One recent poll had Obama (the now-nominee of the Democrats) and McCain (the presumptive Republican) tied at 47% support each. A natural leap was to then assume that the election is a toss-up. But it is really the distribution of support that counts. It is possible to win the election for President of the United States with .00001% of the vote. For instance, suppose only one voter shows up in 49 states, and those voters vote for Obama, and 10,000,000 Republicans vote for McCain in New York, then Obama would lose the national popular vote 10,000,000 to 49 but he would have an overwhelming majority in the electoral college. While the results would never be that extreme, it is certainly possible (and has happened) to win the national popular vote and lose the electoral vote.

Interpreting polls gets more complicated when you try to address the uncertainties in the polls. For instance, the 47% results above are only for those in the survey who had a preference. There are a huge number of “undecided” voters who do not yet have a preference. How should they be handled as we try to figure out who is ahead (I hate this idea of elections as a “horse race”, but if the media is going to see it as a race, they could at least accurately represent the real race)?

Sheldon Jacobson (University of Illinois), Steven Rigdon, and Ed Sewell (both of Southern Illinois University Edwardsville) are addressing this issue by taking the current poll data and determining the probability of winning the election for each candidate. They have a fascinating website that is being constantly updated.

It is worthwhile to read their methodology section.

The mathematical model employs Bayesian estimators that use available state poll results (at present, this is being taken from Rasmussen, Survey USA, and Quinipac, among others) to determine the probability that each candidate will win each of the states. These state-by-state probabilities are then used in a dynamic programming algorithm to determine a probability distribution for the number of Electoral College votes that each candidate will win in the 2008 presidential election.

There is a full paper by the above authors along with Christopher Rigdon.

They point out a few limitations of their approach. Of course, the results are only as good as the poll data: if the poll data is off, then their results are meaningless. Further, they are not (currently) treating Maine and Nebraska correctly: those two states divide their electors by congressional district, while every other state is all-or-nothing.

Currently, they have Barack Obama with an 89% chance of winning, which is pretty high, but down from the 96% chance they had him at on July 31.