I am guest blogging for the INFORMS Conference in Nashville. See my first post on the new INFORMS logo and website.
Mike Trick's Operations Research Blog
Thoughts on the world of operations research
I am guest blogging for the INFORMS Conference in Nashville. See my first post on the new INFORMS logo and website.
I just attended a great talk by Laura McLay at the German OR Society meeting in Aachen. In her semi-plenary, Laura talked about all the work she has done in Emergency Medical Response. Planning the location and operation of ambulances, fire trucks, emergency medical technicians, and so on is a difficult problem, and Laura has made very good progress in putting operations research to use in making systems work better. She has been recognized for this work not only in our field (through things like outstanding paper awards and an NSF CAREER award) but also by those directly involved in emergency response planning, as evidenced by an award from the National Association of Counties.
Laura covered a lot of ground in her talk (she has a dozen papers or more in the area), but I found one result in particular very striking. Many ambulance systems have a goal of responding to 80% of their calls in 9 minutes (or some such numbers). One of the key drivers of those values is the survivability from heart attacks: even minutes matter in such cases.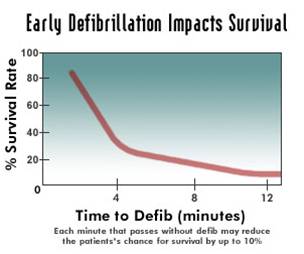 The graph attached (not from Laura, available in lots of places on the internet) shows a sharp dropoff as the minutes tick away.
But why 9 minutes? It is clear from the data that if the goal is to provide response within 9 minutes, there is an awful lot of 8 minute 30 second response times. Systems respond to what is measured. Wouldn’t it be better, then to require 5 minute response times? Clearly more people would be saved since more people would be reached within the critical first minutes. This looks like a clear win for evidence-based medicine and the use of analytics in decision making.
But Laura and her coauthors have a deeper insight than that. In the area they are looking at, which is a mix of suburban and rural areas, with a 9 minute response time, the optimal placement of ambulances is a mixture of suburban and rural locations. With a 5 minute response time, it does no good to place an ambulance in a rural location: they can’t get to enough people in time. All the ambulances would be placed in the higher-density suburban location. If a call comes in from a rural location, eventually an ambulance would wend its way to the rural location, but after 20 or 30 minutes, many cases become moot.
To figure out the optimal response time, you need to figure out both survivability and the number of cases the system can reach. For the area Laura and her team looked at, the optimal response time turned out to be 8 to 9 minutes.
Of course, this analysis is not relevant if the number of ambulances is increased with the decreased response time requirement. But the enthusiasm for spending more on emergency response is not terrifically high, so it is more likely that the time will be changed without a corresponding increase in budget. And that can have the effect of making the entire system worse (though things are better for the few the ambulance can reach in time).
This was a great example of the conflict between individual outcome and social outcomes in emergency response. And a good example of how careful you need to be when using analytics in health care.
I highly recommend reading her Interfaces article “Hanover County Improves its Response to Emergency Medical 911 Patients” (no free version). I even more highly recommend her blog Punk Rock Operations Research and her twitter stream at @lauramclay.
At the recent INFORMS (Institute for Operations Research and the Management Sciences) conference, I was a judge for one of the days for the poster session (or “Interactive Session”, as INFORMS prefers). As a judge, I first spent five minutes each with three participants. After making recommendations for finalists, the entire judging panel (a dozen or so people) then spent five minutes each with five finalists. We then crowned a third place, second place, and first place winner.
A week after the conference, I can describe in detail what each of those eight researchers (all students, I believe) did. I can give you the strengths and weaknesses of the research of the eight posters, and can use them as examples of work that goes on in our field. If I were hiring, I know at least two or three people I would love to have at the Tepper School. All this with forty minutes of engagement.
Contrast this with the presentations I saw in the “regular” sessions. I attended four sessions (not including my own, nor tutorials or plenaries). Each was ninety minutes long, so that makes six hours. During that time, I saw about 14 presentations. I remember about half of them. I didn’t really get a chance to ask questions, and I tuned out of some once I really understood what they were going to inflict on me. Again, there were at least two or three people I would love to have at the Tepper School, some of whom are already here (and I didn’t tune out of those!), but, overall, the talks I saw did not turn out to be as memorable as the interactive presentations.
Worse, consider the plight of a student I know. He was to give a talk in a “regular” session. There were two people in the room other than the speakers. Two speakers did not show. The other talks were on nothing at all similar to what the student had done, so everyone in the room spent his talk reading the bulletin wondering where they would rather be. No questions, no interaction.
Or another student who ended up with just ten minutes to present because the session chair allowed the other, more senior, people to run over. Or another student I saw who had a delightful talk curtailed by technological and other issues. A PhD comic seems particularly appropriate here:
So, I guess my question is: “Why don’t we have more poster interactive sessions?” Or even all poster sessions, except for the tutorials and plenary presentations. It is good for the presenter and good for the participants!
Note added: This also reminds me of having a five minute video as an adjunct to a paper, as this one sent to me by Les Servi. It is a great way to determine if a paper is worth further study.
I have posted to the INFORMS Conference blog again, this time on “Dessert? I like Dessert!”.
It is time again for the highlight of the operations research calendar: the INFORMS Annual meeting. As always, I will be blogging at the INFORMS site, with a copy here. But really: check out the INFORMS blogging site. Lots of bloggers and lots of activity.
Here is my first entry this year:
The INFORMS 2013 conference is ready to start. I think I was the second registrant to check in, since the doctoral colloquium is starting early tomorrow.
As you look at people’s name badges, you may be struck by the tags associated with them. For instance, I ended up with seven tags in my registration envelope, which I think is the largest number of tags I have gotten since I was on the board. Those tags identify participants by some of the special things they are doing at the conference.
Going down though my tags, they run as follows:
- Colloquium. I am speaking at the student colloquium about how to handle the service issues in the profession. For instance, if you do too much service, you might end up with seven tags in your registration envelope.
- Coffee with a Member. This is a great program that matches up first-time attendees with more seasoned people. After 4PM, this turns out to be “Beer with a Member”.
- I’m going Green. I chose not to get a printed program (which weighs about 2 pounds). I am using a really cool app instead.
- I tweet @informs2013. I don’t always tweet, but when I do, I tweet @informs2013. Like all the cool kids
- Blogger. Like, this thing.
- 25+ Year Member. I’m old…
- Fellow. … who did a few things in order to get that nice yellow tag (which I am unironically proud of).
The most important thing to know about those tags is the following
If you see someone with three or more tags, you can ask them anything.
Anyone with multiple tags is truly (and unironically) part of the community. So if you are lost, or confused, or just looking for someone to talk to, grab someone with multiple tags. They are committed to INFORMS. If you have a question, they will find someone who will have the answer. If you are lost, they will work to get you found. And if you don’t have someone else to talk to, they will be happy to talk to you (ask them about their tags). They will talk about INFORMS and the field so much that you will likely need to find another three-tag member for rescue. Because they believe in the field and in INFORMS. And they want you to have a successful conference.
As for seven-tag members, approach them with caution. They are so into the organization that you might end up on a committee!
I am looking forward to the conference, and hope to make a few more friends in the next few days.
I’m putting together a track at the upcoming 10th Metaheuristics International Conference. The conference will be held August 5-8, 2013 in Singapore. The conference website is http://www2.sis.smu.edu.sg/mic2013/
The topic of the Track is Metaheuristics and Optimization/Constraint Programming. There has been a lot of work recently on combining metaheuristics with exact methods. I think it is a very exciting area: faster optimization codes and speedier computers make it easier to use optimization or constraint programming as part of a metaheuristic approach to problems.
If you have some work that you would like to present at the conference, I encourage you to submit that work to the track. Submissions can be in the form of 10 page full papers or 3 page extended abstracts. All submissions are thoroughly reviewed. More information on submission is at the general Call for Papers: http://www2.sis.smu.edu.sg/mic2013/call_for_papers.htm
You will submit your paper through ConfTool at https://www.conftool.net/mic2013/ Note that you will have the opportunity to select the track “Special Session on Meta-Heuristics and Constraint Programming” (or similar: the track is not limited to CP).
The submission deadline is February 28. Please let me know if you have any questions.
 I just got back from a very nice workshop on “Matheuristics” held outside of Rio de Janeiro, Brazil. Matheuristics is the combination of optimization and heuristics. For instance, I talked about large scale local search for sports scheduling problems (among other things). In this approach, portions of a sports schedule are fixed, and you optimize over the rest using integer programming. This has aspects of both metaheuristics (large scale local search) and optimization (integer programming).
I greatly enjoyed the workshop and thank Celso Ribeiro for organizing it and inviting me. It was a small workshop, with perhaps 40 participants, with a single track of papers. For the first time in years I attended every talk at a conference! Try doing that at INFORMS!
My favorite talk was given by Matteo Fischetti of the University of Padova. The talk, entitled “Erraticism in tree search” was a real eye opener in terms of my understanding of how branch-and-bound on integer programs performs in practice. I’m going to paraphrase some of the key points of the talk. None of the numbers in the following are exactly what Matteo presented, but this is close enough to get the idea across.
Here’s the setup: Matteo claims to have a new cut for general mixed integer programs. It is parameterized, so he can actually create 10 different versions of that cut. He downloaded the MIPLIB 2010 benchmarks and some other benchmarks he found, ran default CPLEX on them, and limited his test to hard, but not insolvable instances (tossing out all instances solved by default CPLEX in under 100 seconds or requiring more than 1000 seconds). This left a test bed of 38 instances.
When Matteo solved the testbed using each of the ten cuts (separately), he found something amazing: a single cut often greatly decreased computation time. The (geometric) average decreases over the testbed relative to default CPLEX for the ten different parameterizations were:
| Parametrization | 1 | 2 | 3 | 4 | 5 | 6 | 7 | 8 | 9 | 10 | |
| Decrease | 12% | 14% | 25% | 4% | -0.50% | 32% | 15% | 12% | 6% | 33% | |
Wow! These cuts are great! Cut 5 had a bit of an increase in time, but it turned out that cut was kind of a dummy. Cut 5 took a random permutation of the non-negative integer variables and added a constraint Σ xi ≥ -1. This constraint clearly doesn’t do anything: CPLEX throws it away during preprocessing.
But look at Cut 10. It decreased computation time by 33%. It is amazing! Cut 10 took a random permutation of the non-negative integer variables and added a constraint Σ xi ≥ -1. And that seems to work really well!
Hold on…. What’s going on here? In fact, each of the cuts is simply a random permutation of the variables and a redundant constraint. How can that have any effect?
CPLEX (as with Gurobi or any other solver) has a certain “randomness” in its operation. This is not random in the sense that the final answers are not optimal, but rather the exact operation of the algorithm may depend on things like the ordering of the variables. So, for instance, if a solution to a linear program has multiple optimal solutions, the exact solution reported can depend on which variable is first in the internal ordering of variables. And, of course, the exact solution reported can then affect the branch and bound tree (since different variables might have fractional values).
If you change the internal ordering of the variables, you can change the operation of the branch and bound algorithm. Adding the redundant cut changed the internal ordering of the variables, so the timing results could vary. Not every instance has this aspect. Some have relatively consistent computation time independent of the ordering. But some instances vary a lot based on the ordering.
This is insight 1: branch and bound timings may vary a lot due just to the random choices of the algorithm.
If your computation time is too long, try permuting the variables. If you see lots of variation in computing time, perhaps it it is worth running multiple instances in parallel with different variable orderings (or internal random number seeds) in the hopes that one instance will solve much faster than the others.
This makes me wonder how many past papers showing that an approach is useful are simply showing different (good) random draws from the search tree? And how many good ideas have been discarded due to “bad luck” from the random number generator?
But this still leaves a puzzle: almost every random ordering is better than default CPLEX. Does this mean that you should at least randomly generate an variable ordering? One gentleman at the conference, vibrating with excitement, thought he had the justification for this:
Since most of these instances come from real problems, perhaps there is something about the way people formulate problems that leads to problems with the solution code. As I code, I would normally generate all of one type of variable (say, the “x” variables), then the “y” variables, then the “z” variables. This must be messing up CPLEX. What a great insight!
That hyperventilating gentleman was me. And Matteo quickly and firmly showed that I was wrong. How could almost all of the orderings do better than default CPLEX? Look back, the hint is there…..
How did we get our instances? Let me quote myself:
He downloaded the MIP2010 benchmarks and some other benchmarks he found, ran default CPLEX on them, and limited his test to hard, but not insolvable instances (tossing out all instances solved by default CPLEX in under 100 seconds or requiring more than 1000 seconds).
In doing this, he biased the sample! Anything default CPLEX did well on (under 100 seconds), we threw out! So the sample was made up of things that default CPLEX did not do well on. It is no wonder that “Cut 1” had an advantage. If we had run all the instances on “Cut 1” and threw out anything it did well on, it would turn out the default CPLEX would do better than “Cut 1”. If you toss out instances that an algorithm works well on, don’t be surprised if it does poorly on the rest.
So this is insight 2: if you want to compare algorithms A and B, make sure the definition of the testbed does not depend on which gets label A and which gets label B.
I can’t tell you the number of times I have read computational papers that make the bias mistake. And I rarely noticed it. I will now!
Of course, Matteo doesn’t make mistakes like this in his work: this presentation was an extremely effective way of showing how easy it is to make this error.
I cannot do full justice to Matteo’s talk: there were many more insights and surprises. The associated paper (with Michele Monaci) is here. And if you get a chance to see him give the talk, do so!
After that talk, I will never look at computation in integer programming the same way again. That presentation alone was worth the flight to Brazil!
Added 9/26: Matteo has kindly provided his slides, which are available here.
As I sit in a jet-lagged haze in a Beijing hotel,thoughts naturally turn to …. more travel! The opportunity to travel all around the world is a great bonus of academia. And while I think I have taken this bonus to extremes (I am not sure academics should really be at the highest tiers of frequent fliers), it is nice to visit new places, see new sights, and meet new people.
In operations research, we have a tremendous number of conferences all around the world. It is clear from things like the INFORMS Conference Calendar that a suitably enthusiastic, and financed, researcher could simply spend his or her life bopping around to conferences. For me, this is limited by a couple of things: first, I have an administrative role now, and if I am not around then …. well, I’m not sure what happens, but I feel I should be around. Second, my family already asks for my business card when I return to remind them of who I am. I do not want to make this even worse.
But I do have a few trips planned:
There are a lot more conferences that I would like to attend, both big and small. INFORMS Beijing would be great to attend, but I was in Beijing in November and again right now (for academic administration reasons) so a third trip in 8 months would be too much. PATAT (Practice and Theory of Automated Timetabling) is a series I like very much and is in Oslo, a city I like to visit, but it occurs this year at the start of term so I have to stay in Pittsburgh so that …. again, I’m not sure why I need to academically administrate at that time, but it appears I do. CPAIOR (Constraint Programming, Artificial Intelligence, and Operations Research) is in Nantes, France this year (May 28 – June 1) but is not close enough in timing to the Vilnius EURO conference. Similarly, it is hard not to attend the big International Symposium on Mathematical Programming Symposium in Berlin, but it too is too long after Vilnius and too close to the start of school.
And there are a few conferences in the fall that I am thinking about: Constraint Programming is in Quebec City (a trés bon place to visit!) October 8-12. Computational Social Choice is another interest of mine and will be held in Krakow, Poland September 11-13. Chances are pretty good I’ll be at the main INFORMS Conference in Phoenix October 14-17 (hmmm… I wonder how the flights are from Quebec City to Phoenix): I never miss the chance to get together with 4000 of my closest friends!
I think I’m going to need some optimization models to help choose conferences!
The weather here in Pittsburgh is finally feeling more like winter: it is a dreary, windy day, with intermittent snow. I suspect it will only get worse over the next two months.
Fortunately I know a cure for the winter blues: Optimization! Optimization with the INFORMS crowd, that is, at the Fourth INFORMS Optimization Society Conference, February 24-26, 2012. I’ll be there (I’m the co-chair, so attendance is kinda expected) and I think there is a great slate of plenary and special presentations:
(all these are my gloss on the topic: formal titles and abstracts are coming soon).
Nothing like a bit of optimization to make the world a bit brighter!
If you’d like to submit an abstract for this conference, get a move on: the due date is January 6, 2012. Abstracts are short (300 characters) so it shouldn’t take much time to put something together.
 Oh, and the conference will be in Miami, which might also do some good for getting away from the winter for many of us.
COIN-OR is a project to spur open-source activities in operations research. I am a big supporter of this activity, to the extent that I was part of its Strategic Leadership Board for a term until I did them an even bigger favor by stepping aside for people who could be even better at this than I (not that such people were exactly rare: my time on SLB corresponded to a somewhat over-committed time for me).
Every year COIN-OR gives out an award called the COIN-OR INFORMS Cup. This year’s winner has just been announced, and I think the committee has made an inspired choice:
The submission “OpenSolver: Open Source Optimisation for Excel using COIN-OR”, by Andrew Mason and Iain Dunning, has been selected as the winner of the 2011 edition of the COIN-OR INFORMS Cup. OpenSolver is an “Open Source linear and integer optimizer for Microsoft Excel. OpenSolver is an Excel VBA add-in that extends Excel’s built-in Solver with a more powerful Linear Programming solver.” (from http://opensolver.org)
This year’s award recognizes that lots and lots of people want to use top-notch optimization code, but would like to stay in the world of Excel. The authors of this work (who I am very proud to say come from the University of Auckland (at least in Andrew’s case), where I was a visitor in 2007) have done a great job in integrated the optimization codes from COIN-OR into an easy-to-use interface in Excel. It is a fantastic piece of work (that I blogged about previously) and one that I believe does a tremendous amount of good for the world of operations research. If you can model in Excel’s Solver, then you can plug in OpenSolver and start using the COIN-OR solvers with no limits on problem size. I am also delighted to see that that they have moved to CPL licensing, rather than GPL, which was my only whine in my original post.
Congratulations Andrew and Iain. If you would like to celebrate this award, there is a reception to attend, thanks to IBM:
All entrants and their supporters are welcome to join in the celebration and regale (rile) the prize winners.
Date: Sunday, November 13
Time: 8pm-10pmLocation: The Fox and Hound
330 North Tryon St.
Charlotte, NC 28202
(Directions: http://tinyurl.com/75zhm7k)The celebration is sponsored by IBM.
Good work by the committee:
The COIN-OR INFORMS Cup committee:
Pietro Belotti
Matthew Galati
R. Kipp Martin
Stefan Vigerske
Kiwis and open source rule!
This entry also occurs in the INFORMS Conference blog.
