Using Analytics for Emergency Response

I just attended a great talk by Laura McLay at the German OR Society meeting in Aachen.  In her semi-plenary, Laura talked about all the work she has done in Emergency Medical Response.  Planning the location and operation of ambulances, fire trucks, emergency medical technicians, and so on is a difficult problem, and Laura has made very good progress in putting operations research to use in making systems work better.  She has been recognized for this work not only in our field (through things like outstanding paper awards and an NSF CAREER award) but also by those directly involved in emergency response planning, as evidenced by an award from the National Association of Counties.

Laura covered a lot of ground in her talk (she has a dozen papers or more in the area), but I found one result in particular very striking.  Many ambulance systems have a goal of responding to 80% of their calls in 9 minutes (or some such numbers).  One of the key drivers of those values is the survivability from heart attacks:  even minutes matter in such cases.response  
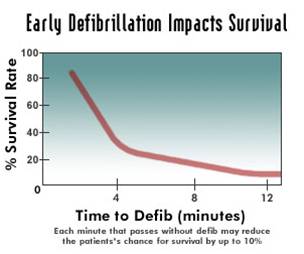
The graph attached (not from Laura, available in lots of places on the internet) shows a sharp dropoff as the minutes tick away.

But why 9 minutes?  It is clear from the data that if the goal is to provide response within 9 minutes, there is an awful lot of 8 minute 30 second response times.  Systems respond to what is measured.  Wouldn’t it be better, then to require 5 minute response times?  Clearly more people would be saved since more people would be reached within the critical first minutes.  This looks like a clear win for evidence-based medicine and the use of analytics in decision making.

But Laura and her coauthors have a deeper insight than that.  In the area they are looking at, which is a mix of suburban and rural areas, with a 9 minute response time, the optimal placement of ambulances is a mixture of suburban and rural locations.  With a 5 minute response time, it does no good to place an ambulance in a rural location: they can’t get to enough people in time.  All the ambulances would be placed in the higher-density suburban location.  If a call comes in from a rural location, eventually an ambulance would wend its way to the rural location, but after 20 or 30 minutes, many cases become moot.

To figure out the optimal response time, you need to figure out both survivability and the number of cases the system can reach.  For the area Laura and her team looked at, the optimal response time turned out to be 8 to 9 minutes.

Of course, this analysis is not relevant if the number of ambulances is increased with the decreased response time requirement.  But the enthusiasm for spending more on emergency response is not terrifically high, so it is more likely that the time will be changed without a corresponding increase in budget.  And that can have the effect of making the entire system worse (though things are better for the few the ambulance can reach in time).

This was a great example of the conflict between individual outcome and social outcomes in emergency response.  And a good example of how careful you need to be when using analytics in health care.

I highly recommend reading her Interfaces article “Hanover County Improves its Response to Emergency Medical 911 Patients” (no free version).  I even more highly recommend her blog Punk Rock Operations Research and her twitter stream at @lauramclay.

Prostates and Probabilities

After a few years hiatus, I finally got back to seeing a doctor for an annual physical last week.  For a 51-year-old male with a fondness for beer, I am in pretty good shape.  Overweight (but weighing a bit less than six months ago), pretty good blood pressure (123/83), no cholesterol issues, all without the need for an drug regime.

Once you hit your mid-to-late 40s  (and if you are a male), doctors begin to obsess about your prostate.  There is a good reason for this:  prostate cancer is the second most common reason for cancer death among males (next to lung cancer).  So doctors try to figure out whether you have prostate cancer.

However, there is a downside to worrying about the prostate.  It turns out that lots of men  have prostate cancer, and most men will die of something else.  The cancer is often slow growing and localized, making it less of a worry.  Cancer treatment, on the other hand, is invasive and risky, causing not only death through the treatment (rare but not negligible) but various annoying issues such as impotence, incontinence, and other nasty “in—“s.   But if the cancer is fast growing, then it is necessary to find it as early as possible and aggressively treat it.

So doctors want to check for prostate cancer.  Since the prostate is near the surface, the doctor can feel the prostate, and my doctor did so (under the watchful gaze of a medical student following her and, as far as I know, a YouTube channel someplace).  When I say “near the surface”, I did not mention which surface:  if you are a man of a certain age, you know the surface involved.  The rest of you can google “prostate exam” and spend the rest of the day trying to get those images out of your mind.

Before she did the exam, we did have a conversation about another test:  PSA (Prostate Specific Antigen) testing.  This is a blood test that can determine the amount of a particular antigen in the blood.  High levels are associated with prostate cancer.  My doctor wanted to know if I desired the PSA test.

Well, as I was recovering from the traditional test (she declared that my prostate felt wonderful:  if it were a work of art, I own the Mona Lisa of prostates, at least by feel), I decided to focus on the decision tree for PSA testing.  And here I was let down by a lack of data.  For instance, if I have a positive PSA test, what is the probability of my having prostate cancer?  More importantly, what is the probability that I have the sort of fast growing cancer for which aggressive, timely treatment is needed?  That turns out to be quite a complicated question.  As the National Cancer Institutes of the NIH report, there is not any clear cutoff for this test:

PSA test results show the level of PSA detected in the blood. These results are usually reported as nanograms of PSA per milliliter (ng/mL) of blood. In the past, most doctors considered a PSA level below 4.0 ng/mL as normal. In one large study, however, prostate cancer was diagnosed in 15.2 percent of men with a PSA level at or below 4.0 ng/mL (2). Fifteen percent of these men, or approximately 2.3 percent overall, had high-grade cancers (2). In another study, 25 to 35 percent of men who had a PSA level between 4.1 and 9.9 ng/mL and who underwent a prostate biopsywere found to have prostate cancer, meaning that 65 to 75 percent of the remaining men did not have prostate cancer (3).

In short, even those with low PSA values have a pretty good chance of having cancer.  There is the rub between having a test “associated with” a cancer, and having a test to determine a cancer.  Statistical association is easy: the correlation might be very weak, but as long as it is provably above zero, the test is correlated with the disease.  Is the correlation high enough?  That depends on a host of things, including an individual’s view of the relative risks involved.  But this test is clearly not a “bright line” sort of test neatly dividing the (male) population into those with cancers that will kill them and those without such cancers.

In the days since my doctor’s appointment, there have been a slew of articles on PSA testing, due to the US Preventative Services Task Force moving towards declaring that PSA testing has no net benefit.  The Sunday New York Times Magazine has an article on prostate screening.  The article includes a wonderfully evocative illustration of the decision to be made:

David Newman, a director of clinical research at Mount Sinai School of Medicine in Manhattan, looks at it differently and offers a metaphor to illustrate the conundrum posed by P.S.A. screening.

“Imagine you are one of 100 men in a room,” he says. “Seventeen of you will be diagnosed with prostate cancer, and three are destined to die from it. But nobody knows which ones.” Now imagine there is a man wearing a white coat on the other side of the door. In his hand are 17 pills, one of which will save the life of one of the men with prostate cancer. “You’d probably want to invite him into the room to deliver the pill, wouldn’t you?” Newman says.

Statistics for the effects of P.S.A. testing are often represented this way — only in terms of possible benefit. But Newman says that to completely convey the P.S.A. screening story, you have to extend the metaphor. After handing out the pills, the man in the white coat randomly shoots one of the 17 men dead. Then he shoots 10 more in the groin, leaving them impotent or incontinent.

Newman pauses. “Now would you open that door?”

Is more information better?  To me, information matters only if it changes my actions.  Would a “positive” PSA test (whatever that means) lead me to different health-care decisions?  And is it really true that more information is always better?  Would my knowing that I, like many others, had cancerous prostate cells (without knowing if they will kill me at 54 or 104) really improve my life?

Perhaps in a few years, we’ll have a some advances.  Ideal, of course, would be a test that unmistakably can determine if a man has a prostate cancer that, untreated, will kill him.  Next best would be better, more individual models that would say, perhaps “A 53 year old male, with normal blood pressure and a fondness for beer, with a prostate shape that causes angels to sing, and a PSA value of 4.1 has an x% chance of having a prostate cancer that, untreated, will kill him with five years.”  Then I would have the data to make a truly informed decision.

This year, I opted against the PSA test, and everything I have read so far has made me more confident in my decision.  Of course, I did not necessarily opt out of PSA testing forever and ever:  I get to make the same decision next year, and the one after that, and the one after that….  But I will spend the time I save in not worrying about PSA testing by working out more at the gym (and maybe adding a bit of yoga to the regime).  That will, I think, do me much more good.

Statistics, Cell Phones, and Cancer

Today’s New York Times Magazine has a very nice article entitled “Do Cellphones Cause Brain Cancer”. The emphasis on the article is on the statistical and medical issues faced when trying to find such a link. On the surface, it seems unlikely that cellphones have a role here. There has been no increase in brain cancer rates in the US over the time you would expect if you believe cellphones are a problem:

From 1990 to 2002 — the 12-year period during which cellphone users grew to 135 million from 4 million — the age-adjusted incidence rate for overall brain cancer remained nearly flat. If anything, it decreased slightly, from 7 cases for every 100,000 persons to 6.5 cases (the reasons for the decrease are unknown).

If it wasn’t for the emotion involved, a more reasonable direction to take would be to study why cellphones protect against brain cancer (not that I believe that either!).

This “slight decrease” is then contrasted in a later study:

In 2010, a larger study updated these results, examining trends between 1992 and 2006. Once again, there was no increase in overall incidence in brain cancer. But if you subdivided the population into groups, an unusual pattern emerged: in females ages 20 to 29 (but not in males) the age-adjusted risk of cancer in the front of the brain grew slightly, from 2.5 cases per 100,000 to 2.6.

I am not sure why 7 down to 6.5 is “slight” but 2.5 to 2.6 is “unusual”. It does not take much experience in statistics to immediately dismiss this: the test divides people into males and females (2 cases), age in 10 year groupings (perhaps 8 cases), and area of brain (unclear, but perhaps 5 cases). That leads to 80 subgroups. It would be astonishing if some subgroup did not have some increase. If this is all too dry, might I suggest the incomparable xkcdIf you test lots of things, you will come up with “significant” results.

Even if the 2.5 to 2.6 was “true”, consider its implications: among women in their 20s, about 4% of the occurrences of a rare cancer are associated with cell phone usage. This association would not be among men, or women 30 years or older or under 20. I am not sure who would change their actions based on this:  probably not even those in the most at risk group!

And there are still a large number of caveats: the causation might well be associated with something other than cell phone usage. While statistical tests attempt to correct for other causes, no test can correct for everything.

There are other biases that can also make it difficult to believe in tiny effects. The article talks about recall bias (“I have brain cancer, I used my phone a lot: that must be issue!”):

some men and women with brain cancer recalled a disproportionately high use of cellphones, while others recalled disproportionately low exposure. Indeed, 10 men and women with brain tumors (but none of the “controls”) recalled 12 hours or more of use every day — a number that stretches credibility.

This issue is complicated by a confusion about what “causes” means. Here is a quick quiz: Two experiments A and B both show a significant increase in brain cancer due to a particular environmental factor. A had 1000 subjects, B had 10,000,000 subjects. Which do you find more compelling?

Assuming both tests were equally carefully done, test A is more alarming. With fewer subjects comes a need for a larger effect to be statistically significant. Test B, with a huge number of subjects, might find a very minor increase; Test A can only identify major increases.  The headline for each would be “X causes cancer”, but the impact would be much different if Test A shows a 1 in 50 chance and test B shows a 1 in a million chance.

With no lower bound on the amount of increase that might be relevant, there is no hope for a definitive study: more and larger studies might identify an increasingly tiny risk, a risk that no one would change any decision about, except retrospectively (“I had a one in a zillion chance of getting cancer by walking to school on June 3 last year. I got cancer. I wish I didn’t walk to school.”). It certainly appears that the risks of cell phone usage are very low indeed, if they exist at all.

There is no doubt that environmental factors increase the incidence of cancer and other health problems. The key is to have research concentrate on those that are having a significant effect. I would be truly astonished if cell phones had a significant health impact. And I bet there are more promising things to study than the “linkage” between cell phones and cancer.

Probability, Mammograms, and Bayes Law

The New York Times Magazine Ideas Issue is a gold mine for a blogger in operations research. Either OR principles are a key part of the idea, or OR principles show why the “idea” is not such a great idea after all.

One nice article this week is not part of the “ideas” article per se but illustrates one key concept that I would hope every educated person would understand about probability. The article is by John Allen Paulos and is entitled “Mammogram Math”. The article was inspired by recent controversy on recommended breast cancer screening. Is it worth screening women for breast cancer at 40 or should it be delayed to 50 (or some other age)? It might appear that this is a financial question: is it worth spending the money at 40 or should we save money by delaying to 50. That is not the question! Even if money is taken out of the equation, it may not be a good idea to do additional testing. From the article:

Alas, it’s not easy to weigh the dangers of breast cancer against the cumulative effects of radiation from dozens of mammograms, the invasiveness of biopsies (some of them minor operations) and the aggressive and debilitating treatment of slow-growing tumors that would never prove fatal.

It would seem to have an intelligent discussion on this, there are a few key facts that are critical. For instance: “Given a 40 year old woman has a positive reading on her mammogram, what is the probability she has treatable breast cancer?” Knowing a woman of roughly that age, I (and she) would love to know that value. But it seems impossible to get that value. Instead, what is offered are statistics on “false positives”: this test has a false positive rate of 1%. Therefore (even doctors will sometimes say), the probability of a woman with a positive reading is 99% likely to have breast cancer (leaving the treatable issue by the side, though it too is important). This is absolutely wrong! The article gives a fine example (I saw calculations like this 20 years ago in Interfaces with regards to interpreting positive drug test results):

Assume there is a screening test for a certain cancer that is 95 percent accurate; that is, if someone has the cancer, the test will be positive 95 percent of the time. Let’s also assume that if someone doesn’t have the cancer, the test will be positive just 1 percent of the time. Assume further that 0.5 percent — one out of 200 people — actually have this type of cancer. Now imagine that you’ve taken the test and that your doctor somberly intones that you’ve tested positive. Does this mean you’re likely to have the cancer? Surprisingly, the answer is no.

To see why, let’s suppose 100,000 screenings for this cancer are conducted. Of these, how many are positive? On average, 500 of these 100,000 people (0.5 percent of 100,000) will have cancer, and so, since 95 percent of these 500 people will test positive, we will have, on average, 475 positive tests (.95 x 500). Of the 99,500 people without cancer, 1 percent will test positive for a total of 995 false-positive tests (.01 x 99,500 = 995). Thus of the total of 1,470 positive tests (995 + 475 = 1,470), most of them (995) will be false positives, and so the probability of having this cancer given that you tested positive for it is only 475/1,470, or about 32 percent! This is to be contrasted with the probability that you will test positive given that you have the cancer, which by assumption is 95 percent.

This is incredibly important as people try to speak intelligently on issues with statistical and probability aspects. People who don’t understand this really have no business having an opinion on this issue, let alone being in a position to make medical policy decisions (hear me politicians?).

Now, I have not reviewed the panel’s calculations on mammogram testing, but I am pretty certain they understand Bayes Law. It makes sense to me that cutting down tests can make good medical sense.

Larry Wein on Post Traumatic Stress

I missed Larry Wein’s op-ed in the New York Times on post-traumatic stress disorder (PTSD), so thanks to Güzin Bayraksan for pointing it out in her blog.  Entitled “Counting the Walking Wounded”, the piece argues that the number of soldiers expected to get PTSD is quite a bit higher than previous estimates (which were in the range of 15%):

We found that about 35 percent of soldiers and marines who deploy to Iraq will ultimately suffer from P.T.S.D. — about 300,000 people, with 20,000 new sufferers for each year the war last.

If you check out the blog for my son Alexander, you will see that we are in the midst of our own “traumatic stress”:  nothing like a soldier in Iraq, of course, but between the passing of my mother and the destruction of our kitchen by a broken pipe, not to mention starting up teaching again and a few other things in my life, I feel mini-PTSD coming on!  Fortunately, playing catch with Alexander is pretty good therapy.

OR Forum paper on Personal Decisions

There is a new paper and discussion at the OR Forum.  Raph Keeney published  a neat paper entitled “Personal Decisions are the Leading Cause of Death” in Operations Research, where he argues that the choices people make (eating, drinking, etc.) cause more deaths than anything else.  There are some very insightful commentaries about this, and I hope the paper and commentaries lead to an interesting discussion.  Check it out!

This paper was the subject of a Newsweek article, and I suspect it will show up more in the media than most OR papers.

Healthcare, Baseball, and Operations Research

The New York Times had an op-ed today about health care written by Billy Beane, Newt Gingrich, and John Kerry.  Billy is the general manager of the Oakland Athletics baseball team and is the primary subject of the book Moneyball, which looked at how a new look at statistics affects a baseball team’s decisions.  What a strange group of coauthors!  Gingrich and Kerry are politicians from the opposite sides of the political spectrum.  My wife (who pointed out the article to me) thought Gingrich and Kerry were strange coauthors:  add in Beane and you are verging on an alternative universe.

The authors argue that health care has got to take a better look at the data, just like baseball teams look at player data.

Remarkably, a doctor today can get more data on the starting third baseman on his fantasy baseball team than on the effectiveness of life-and-death medical procedures. Studies have shown that most health care is not based on clinical studies of what works best and what does not — be it a test, treatment, drug or technology. Instead, most care is based on informed opinion, personal observation or tradition.

They give a number of examples on what happens when people really look at data:

…a health care system that is driven by robust comparative clinical evidence will save lives and money. One success story is Cochrane Collaboration, a nonprofit group that evaluates medical research. Cochrane performs systematic, evidence-based reviews of medical literature. In 1992, a Cochrane review found that many women at risk of premature delivery were not getting corticosteroids, which improve the lung function of premature babies. Based on this evidence, the use of corticosteroids tripled. The result? A nearly 10 percentage point drop in the deaths of low-birth-weight babies and millions of dollars in savings by avoiding the costs of treating complications.

They conclude with a call for looking at the stats:

America’s health care system behaves like a hidebound, tradition-based ball club that chases after aging sluggers and plays by the old rules: we pay too much and get too little in return. To deliver better health care, we should learn from the successful teams that have adopted baseball’s new evidence-based methods. The best way to start improving quality and lowering costs is to study the stats.

The authors are clearly right.  There seems to be great value to looking at the statistics, and this is a necessary step towards rationalizing the system.  The key is making better decisions.  Some of these decisions seem pretty obvious.  But as the decision making gets more complicated, operations research comes into play.  To go back to the baseball analogy, Beane discovered that players with high “on-base percentage” were undervalued by the market, who were paying big money for sluggers (players who hit home runs) instead.  An obvious better decision is to buy up more of the undervalued players.  A more complicated decision would be to form a team that maximized overall output for a given budget constraint.  More complicated still would be forming a team relative to a budget constraint that was affected by team performance.  These more complicated decisions are not the result of a simple rule (“Buy high OBP players”) but rather the result of much more complicated models.

Managing health care, by its nature, requires complicated decision processes.  And that is where operations research comes in (and why I think OR in health care and medicine are two great areas for our field).

Six Kidney Exchange

Following up on a previous post on kidney exchanges and operations research (which becomes a pun in this context!), Johns Hopkins Hospital has just done a six-way kidney exchange.  Interestingly, this was not done done totally with friends and relatives:

The procedure was made possible after an altruistic donor – neither a friend nor relative of any of the six patients – was found to match one of them.

I would think that knowing the effect on six  needy recipients was a great incentive for the altruistic donor.

Thanks to Mark in Auckland for the pointer!

Soo-Haeng Cho and the Influenza Vaccine

I’ve been back in the US for about six weeks now, and am getting used to being back in my academic life. A sign of the slowness of this transition, however, is that our operations management group here at the Tepper School is hiring a junior faculty person, and I didn’t notice, so I have missed most of the job talks. I feel bad about that: the best part of hiring is seeing the best new research from around the world.

Lasts week, Soo-Haeng Cho interviewed here (and did very well by all reports). Soo-Haeng works in a number of areas of operations management, including the use of OM methods in medical decisions. He has a very nice paper on choosing the correct flu vaccine each year. This issue has been in the news recently (including CNN ) because the current vaccine is missing quite a few of the flu bugs. Cho’s paper talks about many of the issues that go into the choice of vaccine, not all of which are reasonably covered by the popular press. In particular, I hadn’t realized the strong advantage of doing the same as last year in terms of getting reliable vaccines out to people.  From his paper:

The production yields of strains are variable and unknown owing to its biological characteristic (Matthews 2006). Moreover, yield uncertainty is increased significantly when a vaccine strain is changed. The magnitude of this challenge is illustrated in the following quote from an industry representative (Committee
2003):
“certainly the best way to ensure this predictability of supply is not to recommend any [strain] changes, … a second best way is to minimize the number of strain changes. Each new strain can yield anywhere from 50 to 120 percent of the average strain.”
Thus, even if a new virus strain is predominant, a change is made only when the benefit from improved efficacy outweighs the risk associated with making the change in production. For instance, although new A/Fujian-like virus strains were widely spreading during the 2002-3 season, the Committee did not select
that strain because it was not suitable for large-scale manufacturing.

It is clear that understanding the medical decision making requires the understanding of manufacturing operations, which I think is a great theme in the upcoming years for our field.

Al Roth on Market Design

Al Roth is a professor at Harvard (formerly the University of Pittsburgh: I still go to his house regularly, though he isn’t there anymore) who has done a lot of work in market design. His big success was work in stable matchings, and its application to the matching system between hospitals and medical residents. This work had a strong OR component: the heart of the system is the algorithm for finding stable matchings (matchings in which there is no resident, hospital pair, both of which would prefer to match with each other rather than the ones they had been assigned). You can get lots of pointers from his game theory, experimental economics, and market design page. Al recently gave a talk at Yahoo! Research as part of their Big Thinkers series. In the talk, he contrasted markets in kidneys (which I talked about a few weeks ago) with the market to match NY high school kids to schools:

Kidney transplants are necessary for end-stage renal disease, but there is a shortage of kidneys. Lack of compatibility and laws against kidney sales open up the possibility of a market designed kidney exchanged to increase the number of transplants. Roth explained the need for national exchanges as opposed to regional exchanges to increase the thickness in the market; 3-way exchanges that will add to a population of incompatible donor pairs; and opening up kidney exchanges to compatible patient-donor pairs as well.

In the example of matching students to high schools in New York City and Boston, where thickness isn’t a problem, there were too many transactions that led to congestion in the market. As many as 30,000 students in New York City were assigned to schools not on their choice list. The newly designed system incorporated a centralized clearinghouse to which students would submit their true preferences, instead of unreachable choices. The algorithm ensured that more students got accepted to their realistic first preferences and minimized the number of those rejected into their second choice pools.

As a side note, these Yahoo! (and Google) videos are a great resource: they attract the very best researchers who all obviously work very hard on their presentations.