Whither Data Mining?

The New York Times Magazine this week is a special issue on debt (a topic that has a particular resonance to me:  we are still paying off an expensive, but spectacular, year in New Zealand!).   There is a fascinating article on what credit card companies can learn about you based on your spending.   For instance,

A 2002 study of how customers of Canadian Tire were using the company’s credit cards found that 2,220 of 100,000 cardholders who used their credit cards in drinking places missed four payments within the next 12 months. By contrast, only 530 of the cardholders who used their credit cards at the dentist missed four payments within the next 12 months.

A factor of 4 is a pretty significant difference.  That should be enough to change the interest rate offered (and 2% default in 2002 is pretty high).   The illustrations to the article go on to suggest that chrome accessories for your car are a sign of much more likely default, while premium bird seed suggests likely on-time payment.

The article was not primarily about these issues:  it was about how companies learn about defaulters in order to connect to them so that they will be more likely to pay back (or will pay back more).  But the illustrations did get me thinking again about the ethics of data mining.  Is it “right” to penalize people for activities that don’t have a direct effect on their ability to payback but only a statistical correlation?  Similar issues came up earlier when American Express started to penalize people who  shopped at dollar stores.

I brought this up during my ethics talk in my data mining course, and my MBA students were split on this.  On one hand, companies discriminate on statistical correlations a lot:  teenage boys pay more for insurance than middle-aged women, for instance.  But it seems unfair to penalize people for simply choosing to purchase one item over another.  Isn’t that what capitalism is about?  But statistics don’t lie.  Or do they?  Do statistics from the past hold equivalent relevancy in today’s unusual economy?  Is relying on past statistics making today’s economy even worse?  Should a company search for something with a more direct correlation or is this correlation enough?

At the Tepper School at Carnegie Mellon, we generally put more faith in so-called structural models, rather than statistical models.   Can we get at the heart of what makes people default on credit card debt?  For instance, spending more than you earn seems one thing that might directly effect the ability to pay back debt.  It is hard to come up with a model where paying for drinks at the bar has a similar effect. But structural models tend to be pretty reduced-form.  It is hard to include 85,000 different items (like in the study reported by the New York Times) in such models.

I vacillate a lot about this issue.  Right now, I am feeling that data mining like the “spend in a bar implies default on credit cards” can lead to interesting insights and directions, but those insights would not be actionable without some more fundamental insight into behavior.  The level of “fundamentalness”  would depend on the application:  if I am simply deciding on a marketing campaign, I might not require too much insight;  if I am setting or reducing credit limits, I would require much more.

I guess this is particularly critical to me since I often play the bank at our Friday Beers.  Since we might have 20 people at Beers, the tab can reach $300, and I sometimes grab the cash from the table and pay by credit card.  Either the credit card companies have to come up with new rules (“If the tip is > 25% [as it often is with us:  they do like us at the bar!], then credit is OK; else ding the record”) or I better hit the ATM on Friday afternoons.
Bernie Madoff and Data Visualization

If you are like most people, when you hear of Bernie Madoff’s Ponzi scheme ripping off investors to the tune of $50 billion, you might think “Oh those poor investors”, or perhaps “Just the rich ripping off the other rich”.  If you do research in a business school, you might wonder about the institutional controls that allowed for such a long-term scam.  But if you are in operations research, you probably think:  what a great source of data!  I wonder what I can do with that?

A couple of the results of the last question (thanks Bryan!):  GeoCommons (“Visual Analytics through Maps”) have a very cool map of Madoff’s investors.  While the map doesn’t contain any information that is not part of the 162 page listing of investors, the visualization leads to lots of interesting questions:  why so much around Denver?  Why so little in Asia?  If there was one person in Auckland, New Zealand involved, is it surprising it was in Parnell?  And who was that guy in Northern Canada who got ripped off, eh?  (The latter appears to be a misplacement:  there is a Lac Carre outside of Montreal).  Other maps are here and here.

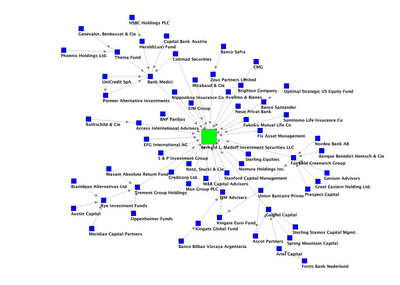
Network from The Network Thinker

Even better is the growing analysis of the social network involved in the Madoff scam.  The Network Thinker has a great graph pointing out who invested with whom (there is also an interactive map).  This leads to all sorts of graph theoretic questions:  what is the longest path in the graph?  What do components of the graph (minus Madoff) correspond to?  Are there cliques or near-cliques in the graph?

This is great data that I am sure will be used in countless dissertations over the next years.  It probably wasn’t worth $50 billion to get that data, but we might as well use it now that we have it.

Visual Display of the Stimulus Package

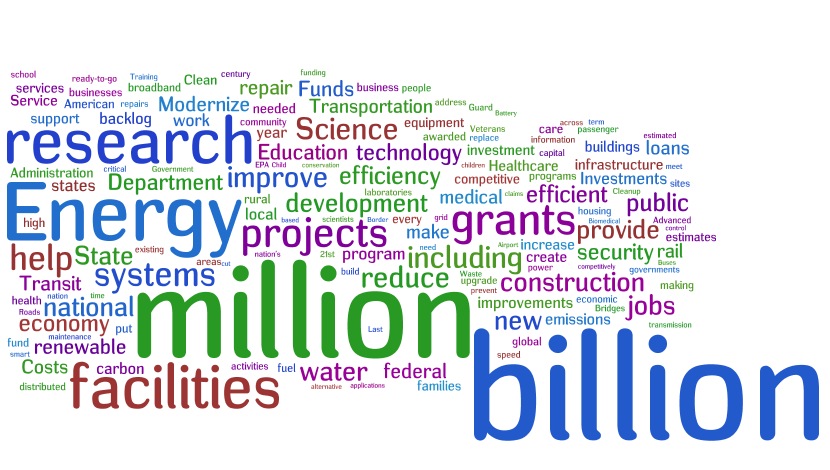
Further to the $787 billion stimulus package (or 78 NSF Stimulus Package, as I like to call it), my finance colleague Bryan Routledge has done a wordle of the summary of the appropriations bill. Here it is (from www.wordle.net):

Stimulus Package Wordl
Stimulus Package Wordle

There is a lot to like in that picture. Certainly “science”, “research”, “grants” and “billion” go together quite nicely.

American Express and Data Mining

I teach a data mining course here to our MBA students.  It is a popular course with about 70% of the students taking it at some point during their two years with us.  Since I am an operations research guy, I concentrate on the algorithms, but we spend a lot of time talk on the use of data mining, and possible pitfalls.  The New York Times today has a wonderful story illustrating the pitfalls.  American Express has been using shopping patterns to reduce customer’s credit limits.  This, in itself, is not surprising, but a letter the company sent out implies that it was basing the evaluation on the stores and companies the customer used, rather than a more direct measure of consumer ability to repay a debt.

“Other customers who have used their card at establishments where you recently shopped,” one of those letters said, “have a poor repayment history with American Express.”

Wow!  Shop at the Dollar Mart, you are not a careful shopper reacting to an uncertain financial world, but rather a poor credit risk who should be jettisoned before defaulting (I don’t know if Dollar Mart is one of the “bad” establishments: American Express has not released a list of companies that are signs of imminent financial doom). That is, of course, what data mining results come down to, but it is rare for a company to admit it.  Not surprisingly, customer’s who received such a letter became a little irate.  Check out newcreditrules.com for one person’s story.

American Express says it is no longer using store shopping information, but it will continue to use the results of data mining in its credit decisions.

In one presentation to analysts, it noted that people with multiple residences and multiple mortgages used to be a good bet. Now, the reverse is true.

In a good economy, lots of data mining was used to “help” customers by identifying new products or offers that might appeal to them.  Now, it seems that more data mining uses the customer’s data against their own interests.  I suspect we will see more stories of this type.

The Numerati

Stephen Baker of BusinessWeek has just published a book entitled The Numerati, and has a blog related to the book.  The purpose of the book is to look how mathematicians are using data to to profile people in their shopping, voting, and even dating habits.

I am not exactly an unbiased reader of the book.  I talked with Stephen during the writing of the book, and he asked me to review the two pages he wrote about “operations research” (I made a couple suggestions which didn’t make it into the final version:  I guess this is my “cutting room floor” experience).  He was kind enough to send me a review copy of the book, which I received a few weeks ago.  He also accepted my invitation to speak here at CMU to the Tepper School Faculty and doctoral students.

The book is divided into chapters corresponding to the different uses of data:  “Worker”, “Shopper”, “Voter”, “Terrorist”, “Patient” and “Lover”.  For instance, in the “Voter” section, the emphasis is on predicting voter behavior.  In the past (perhaps), geography and economics were very good predictors of voting behavior.  Now, people seem much more in flux as to their behavior.  Perhaps there are better predictors.  Or perhaps there are useful clusterings of like-minded people that would respond to a particular pitch.  If Barack Obama were to identify a cluster of “people who blog about obscure  but important mathematical modeling methods”  and would send a mailer (or email more likely) showing his deep understanding of operations research and a promise to use that phrase in his acceptance speech, then perhaps he would gain a crucial set of voters.  Barack, are you listening?

I greatly enjoyed reading the book, and did so in one sitting.  For someone like me who perhaps could be seen as one of the Numerati, there is not much technical depth to the book, but there are a number of good examples that could be used in the classroom or in conversation.  There is a bit too much “The Numerati know much about you and can use it for good or EEEVVVIILLLL” for my taste, but  perhaps I take comfort in understanding how poorly data mining and similar methods work in predicting individual behavior.  The book is very much about modeling people, so essentially ignores the way operations research is used to automate business decisions and processes.  This is a book primarily about what I would call data mining and clustering, so there are wide swathes of the “numerati” field that are not covered.  But for a popular look on how our mathematics is used to characterize and predict human behavior, The Numerati is an extremely interesting book.

Data Visualization

I have always loved Data Visualization (well, always since my adviser John Bartholdi pointed me to Tufte’s classic “Visual Display of Quantitative Information”). I teach data mining here to our MBAs, and have wanted to include the topic, but never knew what to include. Thanks to Stephen Baker of Business Week and his pointer to Many Eyes, I think I am getting an idea. Many Eyes is an IBM site with a goal of making data visualization algorithms and data sets widely available. It is a fantastic place to spend a few hours. As an example of what you can do on the site, here is a tag cloud of my vita (the source is at http://mat.tepper.cmu.edu/trick/vita.pdf):


I think you can find a fair amount about me just by looking at that tag cloud, though I am a bit biased (most ink blots end up looking like me in my eyes). Perhaps even more than by reading through a 12 page vita (by the way, vita (or curriculum vitae) is supposed to meana short account of one’s career and qualifications prepared typically by an applicant for a position”. What ever happened to short? What is the name for the document where you put down every blessed thing you ever did in your academic career?)

The structure of Many Eyes is unusual: you don’t download computer software. Instead, you upload your data (which immediately becomes public, so don’t try this with your financial records) and work with it there. This means that Many Eyes is quickly collecting a huge amount of data (23,256 data sets so far) that it (and you and others) can work with. This “social networking” aspect is unexpected, but I would bet that some interesting results come from it.

Another fascinating site is Wordle, which also creates tag clouds, but does so in a more artistic way. Here is my vita in that form (a couple of versions). I think I will use it during my next salary review!


I think I will need a few more days to recover from my surgery before I can get any useful work done.

Me and Kareem

I teach data mining here at the Tepper School, and one example I use of something that is hard to get computers to do is to recognize faces, a task any 2 month old baby can do reasonably well (at least with regards to mothers). But it seems that MyHeritage.com has this licked: given a photo, they do a great job of seeing who your celebrity look-alikes are. And for me, it was uncanny. I can’t tell you the number of times I have walked down the street and have people say “Aren’t you Kareem Abdul-Jabbar?” That’s assuming they are not mistaking me for the Dalai Lama. I am glad I now have this picture so I can clear up any confusion: that is me in the upper left; Kareem is in the lower left. Perhaps the easiest way to distinguish is to note that I still have some hair on the top of my head. Or perhaps that Kareem is the taller.

Check out the face recognition at http://www.myheritage.com/face-recognition

I’m now hard at work to create the algorithm to prove my real look-alike is George Clooney.