Reading Material While Snowed In

We had a record (21 inch) snowfall on Friday night, if you consider the 4th biggest snowfall of all time (since the 1860s) a record.  Since then, our city seems to be trying to turn this into our own little Katrina, showing very little planning or execution in getting the city back in working order.  City schools are closed and our street has yet to see a plow.  Once a car is painfully extracted from its snow cocoon, a curious Pittsburgh rite begins:  the placement of the kitchen chair.  Since the city is unable to actually remove any snow (it only pushes it around a bit), no on-street parking spaces are cleared except laboriously by hand.  Since it would be manifestly unfair for someone else to use the vacated spot, a kitchen chair is the accepted marker for “If you take this spot, I will curse you and your children and let the air out of your tires”.  Coincidentally,  I have my property tax check waiting to go in the mail.  What exactly am I getting for this high charge?

Anyhow, enough of the rant.  Being snowed in (for three days and counting, and furthermore…. OK, …calm) allows me to read my favorite issue of my favorite journal.  The January-February 2010 Interfaces is now available, and we all know what that means:  the Edelman Papers!  The Edelman, of course, is INFORMS big prize for the practice of operations research.  Every year, a few dozen nominees get whittled down to a half dozen finalists.  These finalists then prepare a fancy presentation, ideally involving a Cxx for suitably impressive xx.  They also put together a paper describing their work.  This is then published in the January-February of Interfaces.

I was a judge in the last competition, so I know the work of the finalists very well.  But it is inspiring to read the final versions of their papers.  I have a course on the applications of operations research that I teach to our MBAs and Edelman papers are generally a highlight of their readings.

In the 2009 competition, the finalists were:

CSX Railway Uses OR to Cash In on Optimized Equipment Distribution
Michael F. Gorman, Dharma Acharya, David Sellers

HP Transforms Product Portfolio Management with Operations Research
Dirk Beyer, Ann Brecht, Brian Cargille, Russ Chadinha, Kathy Chou, Gavin DeNyse, Qi Feng, Cookie Pad, Julie Ward, Bin Zhang, Shailendra Jain, Chris Fry, Thomas Olavson, Holger Mishal, Jason Amaral, Sesh Raj, Kurt Sunderbruch, Robert Tarjan, Krishna Venkatraman, Joseph Woods, Jing Zhou

Operations Research Improves Sales Force Productivity at IBM
Rick Lawrence, Claudia Perlich, Saharon Rosset, Ildar Khabibrakhmanov, Shilpa Mahatma, Sholom Weiss, Matt Callahan, Matt Collins, Alexey Ershov, Shiva Kumar

Marriott International Increases Revenue by Implementing a Group Pricing Optimizer
Sharon Hormby, Julia Morrison, Prashant Dave, Michele Meyers, Tim Tenca

Norske Skog Improves Global Profitability Using Operations Research
Graeme Everett, Andy Philpott, Kjetil Vatn, Rune Gjessing

Zara Uses Operations Research to Reengineer Its Global Distribution Process
Felipe Caro, Jérémie Gallien, Miguel Díaz, Javier García, José Manuel Corredoira, Marcos Montes, José Antonio Ramos, Juan Correa

Any one of them could have been the winner: I really liked all of the work. HP ended up winning(now that I see the author’s list, they certainly had the numbers on their side!). I get to judge again this year, and am once again looking forward to doing that.

So, back to the hot chocolate and the fuming about municipal services… hmmmm… I wonder if I can convince our mayor to use a bit more operations research?
Make Amazon work Better

… if you are qualified, that is.

I don’t normally post job ads on the blog:  there are other outlets for that.   But I have a few reasons for posting this one:

  • I have always been interested in the operations research issues that Amazon faces.  How can they get so much stuff to me in one day?  And when I order twice in one day, why don’t they combine the orders into one box?
  • The person asking is Shivi Shankaran who is a Tepper School MBA alum, and I love pointing out to my MBA students how operations research skills are a real competitive advantage for them.  Other schools may have their students read war stories of the rich and trendy, but we teach real skills here!  We might even get to Benders decomposition in a class this year.
  • I love looking at job descriptions that require experience in XPRESS, CPLEX, and SAS (though they should add Gurobi too).
  • It is my blog, and what is the use of having a blog if you can’t be arbitrary sometimes!

So, if you are PhD in operations research, or highly skilled in the area, here is some information on what they are looking for.  But please check the date of the blog entry (February 3, 2010):  if you come across this entry months from now, the job will be taken!

The Transportation Platform group is looking for a passionate, talented and inventive Operations Research Scientist to join the team. Trans Platform is responsible for optimizing the transportation network for Amazon.com.  The group owns the strategic planning and project management for initiatives involved with the transportation network including long-term forecasting, optimization, and process improvement.  The Operations Research Scientists in the group provide business analysis using mathematical modeling tools to answer important questions for Transportation. You will partner closely with many groups such as operations, IT, retail, and finance teams to support various business initiatives.

– Familiarity with Transportation/Logistics concepts – forecasting, planning, optimization, and logistics – gained through work experience or graduate level education.

– Technical aptitude and familiarity with the design and use of complex logistics software systems.

– Experience working effectively with software engineering teams and the ability to develop system prototypes.

– Ability to code in Java, C++ or another object oriented language and exposure to scripting languages, relational databases and Linux.

– Experience with mathematical libraries like CPLEX, XPRESS, and SAS.

– Excellent written and verbal communication skills.  The role requires effective communication with senior management as well as with colleagues from computer science, operations research and business backgrounds.

– A graduate degree in operations research, statistics, engineering, mathematics or computer science is requirement, PhDs highly desired.

The job is based in Seattle and we pay competitively. Please have them get in touch directly with me at shivi@amazon.com.

What Panels would you Like to See?

The organizers at this Fall’s INFORMS Meeting (theme of the conference: “Willie, Lance, and Optimizing the Music Scene in Austin”) have asked me to organize a series of panel discussions (or other “not four papers, each of 22.5 minutes” form) on topics of interest.  These panels should not be on technical topics but rather on issues of professional interest.  What would make for a good panel?  Here are a few possibilties:

  • Blogging, Twitter, and Facebook: Role for Operations Researchers (of course!)
  • Editors Panel:  How to be a successful author, referee, and editor
  • Funding Agencies: How and why to get funding
  • The Academic/Industry Interface: How Industry can Support Academia and vice versa
  • Role of Operations Research in Business Schools
  • Role of Operations Research in Undergraduate Education
  • Department Heads Panel: The Future of Industrial Engineering Departments
  • Dean’s Panel: Operations Research as a Path to Academic Leadership

What would you like to see?    Do any of the above particularly resonate?  What would you add? Other than a panel discussion (or four 22.5 minute talks, and please hold all questions until the next conference), what would be an interesting format to present some of this?

If you have some suggestions of possible panel organizers or members, please feel free to email me those personally.

AIMMS Contest

I can’t resist competitions in operations research.  It brings out the competitor in me, even if it is more like ESPN and sports:  I like to watch others doing the work!

AIMMS (whose software I use in class) is sponsoring their second modeling competition, in conjunction with this year’s MOPTA (Modeling and Optimization: Theory and Applications) conference.  Last year’s competition was on scheduling trucks subject to maintenance requirements.  This year’s competition is on creating financial portfolios that embed tax issues:

Classical models used in portfolio optimization focus on return and risk. More complicated models take into account the effect of trading costs. In this case study your team will have to develop a tool to optimize a portfolio in the presence of different tax rules.

Financial models are not really my thing, but the case looks rich and interesting.  I think next year when we do the course, we might just assign the competition as the course project and see if our students can come up with a competitive result.

If anyone at CMU would like to take this on, and would like some faculty support (arranging for an independent study or similar), let me know:  it looks like  a lot of fun.

(In the interest of full disclosure, I should note that my colleague Willem van Hoeve arranged to get the AIMMS software for free for our course.   With AIMMS, we use Gurobi under their standard (free) academic licenses.)

Yo Trick! Where’ve you been?

I was annoyed at myself this morning when I realized that January was almost over and I had only 3 blog posts.  Since my goal is 3/week, it is clear that I am getting the year off on the wrong foot.   I could, of course, put in eight or so posts on being too busy to post (kinda like a tweet I had about being too busy to tweet!) but I don’t think my audience would fall for that:  being OR people, they are pretty smart and can see through such an obvious ploy.

But it has been an interesting month, so I thought I would update on some of things that are happening in my life.  Perhaps this will also help with the question “What does a faculty member do all day long?”

I’ll begin with teaching, since this is a pretty heavy teaching period, with two courses and three sections:

The first course is “Mining Data for Decision Making”, a course that I created back in 2000 for our MBA students.  This course is extremely popular with the MBAs and I ended with with full classes (80 students each) for the two sections, with about 40 on the waiting list.  After a couple less-than-stellar lectures, I got it whittled down to 7 left on the waiting list by the time the add-drop deadline came by.  One quick vignette:  In an early class, we talk about supermarket affinity cards and how much information you give supermarkets about yourself when you use their cards.  I point out that in return for that information, supermarkets give you discounts and perhaps can better tune their advertising efforts to your individual interests.  Of course, this can work against you:  if a supermarket believes that you will certainly buy a particular salsa, do you think they will give you a coupon for that salsa?  Should they give you such a coupon?  Since their actions are unclear, it is uncertain whether they are helping or hurting you with the information you give them.

That night, we got an automated call from our local supermarket saying that some hash browns we bought a few months ago were tainted with listeria (my wife’s response: “You cook once a month and even then you poison us!”).  They knew we bought the hash browns from the affinity card data, showing an advantage for using the card and providing correct contact data.

The other course I am involved with is Operations Research Implementations.  Our goal in this MBA course is to get way beyond the “four variable, three constraint” formulations and to get students doing things that look more like real-world projects.  We were lucky had had 20 students sign up, which is an ideal size for this type of course.  We chose AIMMS as our modeling package, with Gurobi as the underlying software. I am co-teaching this course with Willem van Hoeve. My main goal was to learn how to use AIMMS, and it has gone very well so far.  I also continue to be very impressed with the Gurobi solver.

For this course, students do a project (in teams), either from us or chosen on their own.  The ones we offered were

  1. Truck contracting (ala work I did with the postal service)
  2. Sports scheduling for a purpose-built little league complex
  3. Inbound distribution routing
  4. Wildlife corridor design

One group has already decided to do a project on their own:  ad placement in an online environment.  We’ll see whether other groups have their own ideas of if they are going to pick from the above).

More later on about doing academic administration, journal activities, and all the other things faculty members do.

Operations Research: Growth Industry!

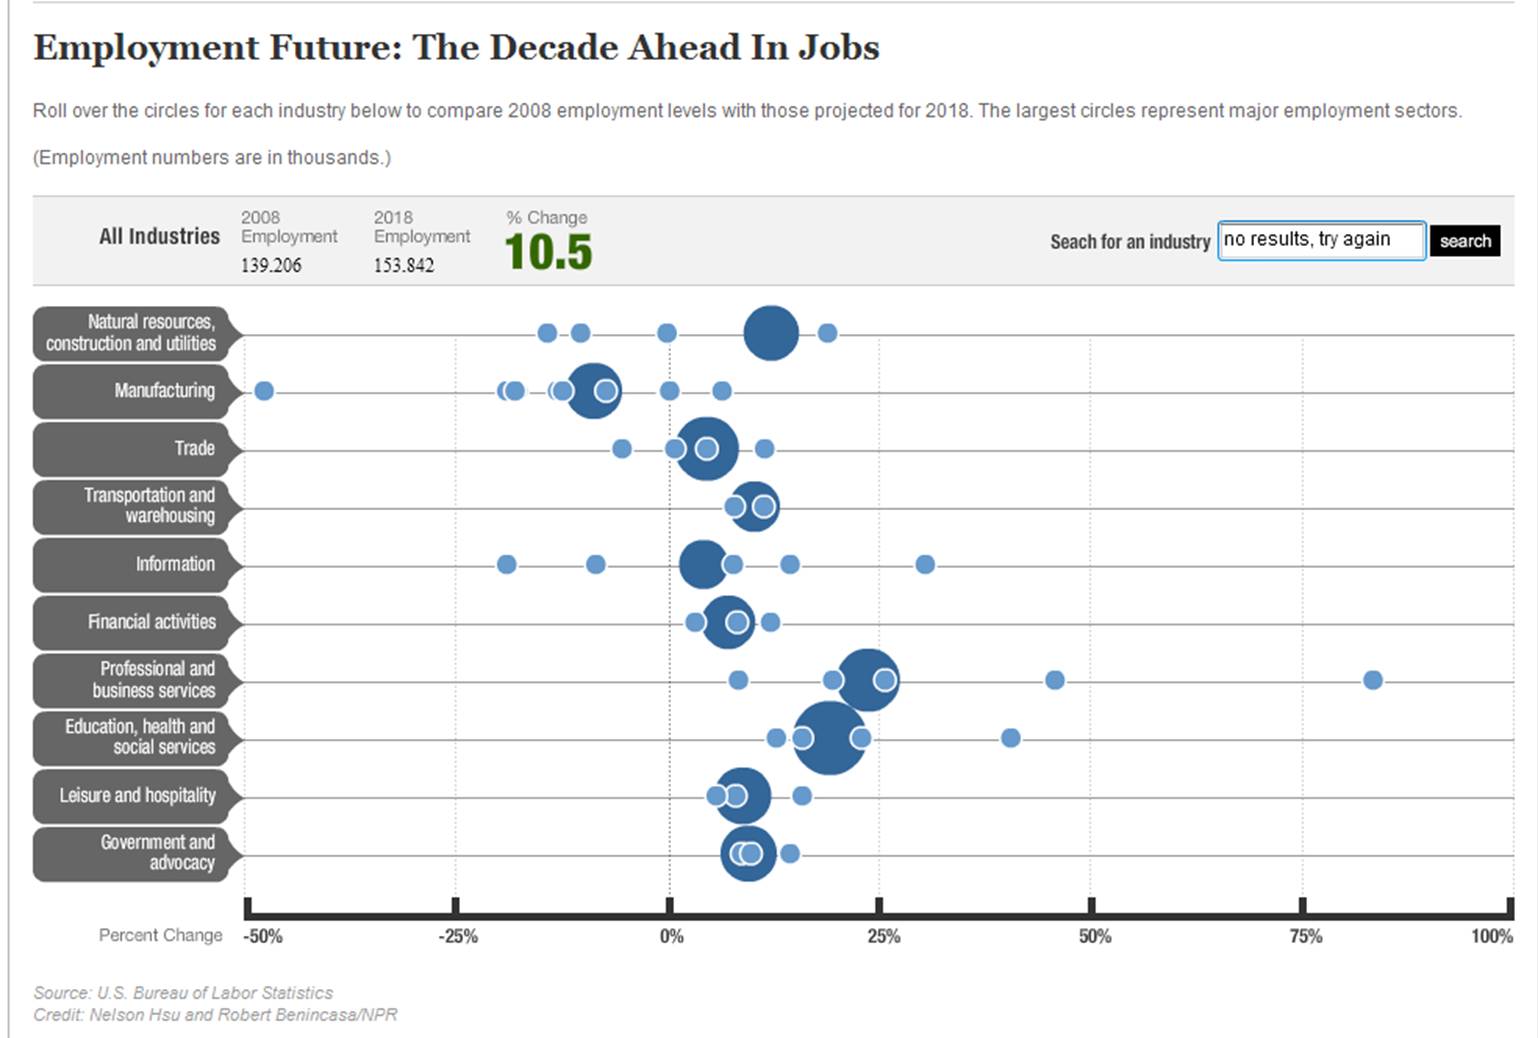
NPR has a nice graphic for where job growth will occur in the next decade based on US Bureau of Labor Statistics data (the NPR site is much cooler than the graphic above). Now, operations research is a little small to appear as a dot on its own, but if you look at that little dot far to the right, showing the most job growth? That is “Management, Scientific, and Technical Consulting Services”. And what field is all of “management, scientific and technical”? Operations Research, of course! The projection is for 82.8% growth.

There are some other interesting dots that might guide those in our field. Note the big dot second from the top. That is Manufacturing, with a 9% loss in jobs. Some of that might be due to efficiencies from our field, but I suspect most is due simply to a shrinkage in importance of manufacturing to the US economy. Some of the big growth areas? Education, health care and construction with growth in the 15-25% range. This suggests that applying operations research in the service industries is going to be a big driver of growth in our field (unless we miss the boat and let another field do operations research there under a different name).

Thanks to the INFORMS Facebook Page for the pointer!

Data Mining, Operations Research, and Predicting Murders

John Toczek, who writes the PuzzlOR column for OR/MS Today  (example), has put together a new operations research/data mining challenge in the spirit of, though without the million dollar reward of, the Netflix Prize.  The Analytics X Prize is a  fascinating problem:

Current Contest – 2010 – Predicting Homicides in Philadelphia

Philadelphia is a city with 5.8 million people spread out over 47 zip codes and, like any major city, it has its share of crime.  The goal of the Analytics X Prize is to use statistical techniques and any data sets you can find to predict where crime, specifically homicides, will occur in the city.  The ability to accurately predict where crime is likely to occur allows us to deploy our limited city resources more effectively.


What I really like about this challenge is how open-ended it is. Unlike the Netflix Prize, there is no data set to be analyzed. It is up to you to determine what might be an interesting/useful/important data set. Should you analyze past murder rates? Newspaper articles? Economic indicators? Success in this might require a team that mixes those who understand societal issues with data miners and operations researchers. This, to me, makes it much more of an operations research challenge than a data mining challenge.

I also like how the Prize handles evaluation: you are predicting the future, so murders are counted after your submission. Unless you have invented time travel, there is no way to know the evaluation test set, nor can you game it like you could in the Netflix Prize (at the risk of overfitting).

I asked John why he started this prize, and he replied:

I started this project about a year ago when trying to think of ways to
attract students and people from other professions into the OR field. I
write an article in ORMS Today called the PuzzlOR which I originally
started in hopes of attracting more students to our field. OR can be a bit
overwhelming when you first get into it so I wanted a way to make it easier
for the newcomers. The puzzles I wanted to run were getting a bit out of
hand in their complexity so I needed some other place to house them.

Plus, I thought it would be good advertising for the OR field in general
and would have positive impact on the city where I live.

He’s already gotten good local press for the project. The Philadelphia City Paper ran a nice article that mentions operations research prominently:

Operations research may not sound sexy; it focuses on analytics and statistics — determining which data in a gigantic data haystack is most relevant — in order to solve big problems.

There is a monetary prize involved: $20 each month plus $100 at the end of the year. It is probably a good thing that this is not a million dollar prize. Since entries are judged based on how well they do after submission, too high a prize might lead to certain … incentives … to ensure the accuracy of your murder predictions.

The Magical Places Operations Research Can Take You

Art Benjamin of Harvey Mudd College has an article in this week’s Education Life section of the New York Times where he gives ten mathematical tricks.

I first met Art in the late 80s at, I believe, a doctoral colloquium sponsored by ORSA/TIMS (now INFORMS). Art was clearly a star: he won the Nicholson Prize (Best Student Paper) in 1988. If he had stuck with the “normal path” of being an academic researcher, I have no doubt that he would now be well known in operations research academia.

But his real passion was lightning calculation and other forms of mathematical magic and in keeping with that path, he has made himself even better known to a much broader audience. He has published three books aimed at the general audience, including one that was a Book-of-the-Month Club selection (is this unique in operations research?). He has an amazing act that he performs for a wide range of audiences.

His research has moved out of operations research  into combinatorics and combinatorial games (though these areas have a lot of overlap with OR), where he publishes prolifically and has two books aimed at professionals. His book “Proofs that Really Count” (along with Jennifer Quinn) is a great introduction to combinatorial proofs.

Art is another example of the variety of paths you can take after an operations research degree.

Operations Research Embarrassments and the Traveling Tournament Problem

Dick Lipton of Georgia Tech has a very nice blog on the theory of computation (though it ranges broader than that). He has a fascinating post on “Mathematical Embarrassments”. A “Mathematical Embarrassment” does not refer to the mistaken proof I had in a real analysis course twenty five years ago (that still causes me to cringe) or a similar goof. Instead, it is defined as:

A mathematical embarrassment (ME) is a problem that should have been solved by now. An ME usually is easy to state, seems approachable, and yet resists all attempts at an attack.

This contrasts with a Mathematical Disease (MD), which is harder to define but has a number of characteristics:

1. A problem must be easy to state to be a MD. This is not sufficient, but is required. Thus, the Hodge-Conjecture will never be a disease. I have no clue what it is about.
2. A problem must seem to be accessible, even to an amateur. This is a key requirement. When you first hear the problem your reaction should be: that is open? The problem must seem to be easy.
3. A problem must also have been repeatedly “solved” to be a true MD. A good MD usually has been “proved” many times—often by the same person. If you see a paper in arXiv.org with many “updates” that’s a good sign that the problem is a MD.

So, in operations research we see many people catch the “P=NP (or not)” disease, but I would not call the problem an embarrassment.

Lipton has a number of good examples of mathematical embarrassments, some of which overlap with the skills/interests of more mathematically inclined operations researchers, but none are “really” operations research. For instance, it seems that proving that both the sum and difference of pi and e are transcendental would be a homework problem from centuries ago, but it is still open. That is an embarrassment!

So what would be an operations research embarrassment?

On the computational side, I think of the Traveling Tournament Problem as a bit of an embarrassment (embarrassment is too strong for this: perhaps this is an “operations research discomfiture”). It is a sports scheduling problem that is easy to state, but even very small instances seem beyond our current methods. It was a big deal when the eight team problem was solved!

Just this month, I received word from New Zealand that the three 10-team examples (NL10, CIRC10, and Galaxy10) have all been solved (by David Uthus, Patricia Riddle, and Hans Guesgen). This is huge for the couple of dozen people really into sports scheduling! Proving optimality for this size takes 120 processors about a week so I would say that the problem is still a discomfiture.

But a discomfiture is not an embarrassment. The problem, though simple to state, is too small to rank as an embarrassment. So what would an “operations research embarrassment” be? And are there other “operations research diseases” other than P=NP (though one could argue that by causing people to spend computer-years in solving Traveling Tournament Problems, I may have infected some with a mild disease).

Probability, Mammograms, and Bayes Law

The New York Times Magazine Ideas Issue is a gold mine for a blogger in operations research. Either OR principles are a key part of the idea, or OR principles show why the “idea” is not such a great idea after all.

One nice article this week is not part of the “ideas” article per se but illustrates one key concept that I would hope every educated person would understand about probability. The article is by John Allen Paulos and is entitled “Mammogram Math”. The article was inspired by recent controversy on recommended breast cancer screening. Is it worth screening women for breast cancer at 40 or should it be delayed to 50 (or some other age)? It might appear that this is a financial question: is it worth spending the money at 40 or should we save money by delaying to 50. That is not the question! Even if money is taken out of the equation, it may not be a good idea to do additional testing. From the article:

Alas, it’s not easy to weigh the dangers of breast cancer against the cumulative effects of radiation from dozens of mammograms, the invasiveness of biopsies (some of them minor operations) and the aggressive and debilitating treatment of slow-growing tumors that would never prove fatal.

It would seem to have an intelligent discussion on this, there are a few key facts that are critical. For instance: “Given a 40 year old woman has a positive reading on her mammogram, what is the probability she has treatable breast cancer?” Knowing a woman of roughly that age, I (and she) would love to know that value. But it seems impossible to get that value. Instead, what is offered are statistics on “false positives”: this test has a false positive rate of 1%. Therefore (even doctors will sometimes say), the probability of a woman with a positive reading is 99% likely to have breast cancer (leaving the treatable issue by the side, though it too is important). This is absolutely wrong! The article gives a fine example (I saw calculations like this 20 years ago in Interfaces with regards to interpreting positive drug test results):

Assume there is a screening test for a certain cancer that is 95 percent accurate; that is, if someone has the cancer, the test will be positive 95 percent of the time. Let’s also assume that if someone doesn’t have the cancer, the test will be positive just 1 percent of the time. Assume further that 0.5 percent — one out of 200 people — actually have this type of cancer. Now imagine that you’ve taken the test and that your doctor somberly intones that you’ve tested positive. Does this mean you’re likely to have the cancer? Surprisingly, the answer is no.

To see why, let’s suppose 100,000 screenings for this cancer are conducted. Of these, how many are positive? On average, 500 of these 100,000 people (0.5 percent of 100,000) will have cancer, and so, since 95 percent of these 500 people will test positive, we will have, on average, 475 positive tests (.95 x 500). Of the 99,500 people without cancer, 1 percent will test positive for a total of 995 false-positive tests (.01 x 99,500 = 995). Thus of the total of 1,470 positive tests (995 + 475 = 1,470), most of them (995) will be false positives, and so the probability of having this cancer given that you tested positive for it is only 475/1,470, or about 32 percent! This is to be contrasted with the probability that you will test positive given that you have the cancer, which by assumption is 95 percent.

This is incredibly important as people try to speak intelligently on issues with statistical and probability aspects. People who don’t understand this really have no business having an opinion on this issue, let alone being in a position to make medical policy decisions (hear me politicians?).

Now, I have not reviewed the panel’s calculations on mammogram testing, but I am pretty certain they understand Bayes Law. It makes sense to me that cutting down tests can make good medical sense.