Careful with Wolfram|Alpha

Wolfram|Alpha is an interesting service. It is not a search engine per se. If you ask it “What is Operations Research” it draws a blank (*) (mimicking most of the world) and if you ask it “Who is Michael Trick” it returns information on two movies “Michael” and “Trick” (*). But if you give it a date (say,  April 15, 1960), it will return all sorts of information about the date:

Time difference from today (Friday, July 31, 2009):
49 years 3 months 15 days ago
2572 weeks ago
18 004 days ago
49.29 years ago

106th day
15th week

Observances for April 15, 1960 (United States):
Good Friday (religious day)
Orthodox Good Friday (religious day)

Notable events for April 15, 1960:
Birth of Dodi al-Fayed (businessperson) (1955): 5th anniversary
Birth of Josiane Balasko (actor) (1950): 10th anniversary
Birth of Charles Fried (government) (1935): 25th anniversary

Daylight information for April 15, 1960 in Pittsburgh, Pennsylvania:
sunrise | 5:41 am EST\nsunset | 6:59 pm EST\nduration of daylight | 13 hours 18 minutes

Phase of the Moon:
waning gibbous moon (*)

(Somehow it missed me in the famous birthdays: I guess their database is still incomplete)

It even does simple optimization

min {5 x^2+3 x+12}  =  231/20   at   x = -3/10 (*)

And, in discrete mathematics, it does wonderful things like generate numbers (permutations, combinations, and much more) and even put out a few graphs:
graphs(*)

This is all great stuff.

And it is all owned by Wolfram who define how you can use it. As Groklaw points out, the Wolfram Terms of Service are pretty clear:

If you make results from Wolfram|Alpha available to anyone else, or incorporate those results into your own documents or presentations, you must include attribution indicating that the results and/or the presentation of the results came from Wolfram|Alpha. Some Wolfram|Alpha results include copyright statements or attributions linking the results to us or to third-party data providers, and you may not remove or obscure those attributions or copyright statements. Whenever possible, such attribution should take the form of a link to Wolfram|Alpha, either to the front page of the website or, better yet, to the specific query that generated the results you used. (This is also the most useful form of attribution for your readers, and they will appreciate your using links whenever possible.)

And if you are not academic or not-for-profit, don’t think of using Wolfram|Alpha as a calculator to check your addition (“Hmmm… is 23+47 really equal 70? Let me check with Wolfram|Alpha before I put this in my report”), at least not without some extra paperwork:

If you want to use copyrighted results returned by Wolfram|Alpha in a commercial or for-profit publication we will usually be happy to grant you a low- or no-cost license to do so.

“Why yes it is. I better get filling out that license request!  No wait, maybe addition isn’t a ‘copyrighted result’.  Maybe I better run this by legal.”

Groklaw has an interesting comparison to Google:

Google, in contrast, has no Terms of Use on its main page. You have to dig to find it at all, but here it is, and basically it says you agree you won’t violate any laws. You don’t have to credit Google for your search results. Again, this isn’t a criticism of Wolfram|Alpha, as they have every right to do whatever they wish. I’m highlighting it, though, because I just wouldn’t have expected to have to provide attribution, being so used to Google. And I’m highlighting it, because you probably don’t all read Terms of Use.

So if you use Wolfram|Alpha, be prepared to pepper your work with citations (I have done so, though the link on the Wolfram page says that the suggested citation style is “coming soon”: I hope I did it right and they do not get all lawyered up) and perhaps be prepared to fill out some licensing forms.  And it might be a good idea to read some of those “Terms of Service”.

——————————————–
(*) Results Computed by Wolfram Mathematica.
How to Design a Contest: The Netflix Challenge

It looks like the Netflix people made some good decisions when they designed their million dollar challenge. In particular, it appears that they kept two verification test sets: one that was the basis for the public standings and one that no one ever saw the results from. It is the success on the latter set that determines the winner. So BelKor, which appeared to come in second, based on the “public” verification test set, seems poised to be the winner based on the hidden test set. I put “public” in quotes, since the test set itself was not visible, but the results of each prediction on the test set was visible (as an aggregate statistic).

Why is this a good design? Any data set that gets as much of a workout as the public data set does is vulnerable to techniques that try to fit the model to that particular test set. In fact, there was discussion at the Netflix competition forum that some team or teams was doing exactly that: generating hundreds of slightly different predictions in an attempt to better fit the verification set. Such an approach, however, is counterproductive when it comes to working with a new, hidden data set. Any team that overfits the first verification test set is likely to do poorly on the second set.

So we’ll wait for official word, but it seems as though Netflix has a very nicely designed evaluation system

Three City Traveling Salesman Problem Solved by Bacteria!

A Guardian (London) article has the provocative title “Bacteria make computers look like pocket calculators” (thanks Hamish for the pointer). They report on how bacteria can be used to search through feasible solutions to the traveling salesman problem to find optimal solutions:

The research, published today in the Journal of Biological Engineering, proves that bacteria can be used to solve a puzzle known as the Hamiltonian Path Problem. Imagine you want to tour the 10 biggest cities in the UK, starting in London (number 1) and finishing in Bristol (number 10). The solution to the Hamiltonian Path Problem is the the shortest possible route you can take.

This simple problem is surprisingly difficult to solve. There are over 3.5 million possible routes to choose from, and a regular computer must try them out one at a time to find the shortest. Alternatively, a computer made from millions of bacteria can look at every route simultaneously. The biological world also has other advantages. As time goes by, a bacterial computer will actually increase in power as the bacteria reproduce.

Programming such a computer is no easy task, however. The researchers coded a simplified version of the problem, using just three cities, by modifying the DNA of Escherichia coli bacteria. The cities were represented by a combination of genes causing the bacteria to glow red or green, and the possible routes between the cities were explored by the random shuffling of DNA. Bacteria producing the correct answer glowed both colours, turning them yellow.

Where to begin? Does that article really talk about the 3-city TSP?

The belief that NP-completeness means that you have to search through every possibility fundamentally misunderstands fifty years of research in computational combinatorial optimization. The “three city” TSP was solved essentially as soon as it was defined. Even the 10 city TSP was solved long before people wanted to look through 3.5 million choices.

Even given the premise that bacteria can look through all possibilities, where does that leave us? Computationally, I really think that 300 cities is a good lower bound for exact work on the TSP (see Concorde, and the discussion given in a previous post). If someone has a bacterial technique that might work on 10 cities, how will it work on a system with 10^600 times the number of solutions? Will you have 10^600 bacteria? For those confused by orders of magnitude, the human body has about 10^14 cells (perhaps) and the universe has perhaps 10^80 atoms. I am glad that Bill Cook and his coauthors did not need to find 10^520 other universes to work with when solving 300 city TSPS, let alone the number needed for solving the 85,900 city problem they have solved (about 10^869527 possible tours).

Now, maybe the Guardian is not the best place to look for scientific detail. Going to the original paper, however, does not make one very confident:

The serial approach that most silicon computer algorithms use is not well suited for
solving NP-complete problems because the number of potential solutions that must be evaluated
grows combinatorially with the size of the problem. For example, a Hamiltonian Path Problem
for a directed graph on ten nodes may require as many as 10! = 3,628,800 directed paths to be
evaluated. A static number of computer processors would require time proportional to this
number to solve the problem. Doubling the number of nodes to 20 would increase the possible
number of directed paths to 20! = 2.43 x 10^18, increasing the computational time by 12 orders of
magnitude. Improvement in computational capability could come from parallel processing and
an increase in the number of processors working on a problem. Significant breakthroughs in this
regard may be possible with the development of biological computing, because the number of
processors grows through cell division.

OK, biologists, tell us about 10^600 parallelism. The “serial approach that most silicon computer algorithms use is not well suited for solving NP-complete problems” handles 300 cities pretty easily.

Don’t get me wrong. I think it is really cool that bacteria can solve traveling salesman problems. I think it would be equally cool if you could put together a Lego system that can solve 10 city traveling salesman problems. I have an issue, though, when the researchers believe they are really saying anything about solving NP-hard problems. Talk about relaxations and heuristic solutions, and then I am fascinated. Talk about comparisons to complete enumeration, and I have much less interest.

Contrary to the Guardian title, I think computers are still looking like computers, and biological systems have a long way to go to compete with calculators, at least as far as the TSP goes.

Usage and Reddit

For the most part, I don’t live or die on the number of readers of this blog.  I’m not making money off this, so extra readers don’t  have a direct effect.  Of course, I am gratified that people want to read this:  since one of my goals is to make operations research more famous, it helps if there is a readership!  And I greatly enjoy it when people comment on my posts (something that is happening much more often):  that can’t happen without a readership.

Determining the readership of a blog is kinda tricky.  Some people wander by through the web, or have the page bookmarked, or search on a term that occurs in a blog post, or otherwise access the blog as a web page.  Somewhere around 150 or so people a day see the blog that way.  Of course a number of people are searching for “sex market” or some such, and hit a post from my past entries that includes those words. In fact, now that I have included that phrase here, they may end up on this page.  If so, then welcome:  this probably isn’t what you were looking for, but there are some fascinating posts, so browse around for a while!

Another group subscribes to the blog through RSS readers, like google reader.  They may not hit my website directly at all, but read the postings through their reader.  Feedburner tells me I have about 700 subscribers that way.  This number is an estimate, but presumably all of these subscribers are actually interested in operations research.  This is the way I access blogs:  I subscribe to all of the operations research blogs listed in the right hand column of my front page, and I subscribe to an additional twenty-five blogs that are not operations research but have caught my interest.  I also subscribe to about dozen blogs on operations research that appear to be inactive:  if a post comes through on one of those, then I can move it over to the active list.

Putting things all together, I put my readership at about 1000 people truly interested in operations research, which is a gratifying number.  I certainly have not given a technical talk in front of 1000 people (the recent EURO conference was perhaps the largest, but it was not 1000 people).

Usage at mat.tepper.cmu.edu/blog

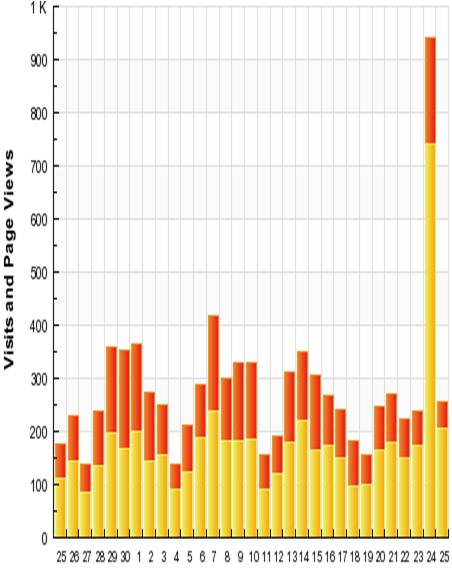
Once in a while I get a spike, due to an entry on other sites.  I have never had a successful entry on Digg or Slashdot, which is probably just as well, since my poor server probably couldn’t stand the strain.  But my recent posting on “P=NP (or not)” did get some play on Reddit (thanks cavedave for the shoutout), which resulted in a spike in usage (up by a factor of five or so).   It was great to see the spike, but it will be even better if this results in more permanent subscribers and more interest in operations research.

P=NP …

… or not.

About 20 years ago, I attended a summer program at RUTCOR (the OR center at Rutgers) called, I believe, ARIDAM (Advanced Research Institute in Discrete Applied Mathematics?  Something like that).  It was a great few weeks:  I learned a lot and met a number of people for the first time who I know to this day.  If my memory holds, it was at that conference that we heard about work by a University of Guelph professor named Ted Swart that purported to prove that P=NP.  In his paper, Swart gave a n^5 variable (or n^7) linear programming formulation for the hamiltonian path problem, along with a complicated case-by-case proof that this linear program had a solution if and only if the graph had a hamiltonian cycle.  I remember staying up two nights in a row working through this paper with people like Harvey Greenberg.  At the end, we identified a hole in the proof.  Swart changed things around a bit, and I lost track of where things went:  I recall thinking that it was pretty clear that adding a subscript could get around any hole we found, but that any constant number of subscripts would leave ever-more-complicated holes in the proof.  I left it there.

If I had been brilliant, I might have asked the question whether you could prove that this type of formulation cannot work.  I’m not that brilliant, but Mihalis Yannakakis is, and he proved shortly thereafter that any symmetric formulation for this problem requires exponential size.

Since then, it is stunning how often proofs that P=NP (or P not equal to NP) crop up.  Gerhard Woeginger does the field a tremendous service by collecting pointers to papers that try to prove the question one way or the other.   The rate of production for these sorts of results seems to be growing, with 10 papers in 2008 and 2009.  I very much like Gerhard’s obsessive neutrality in this.  It is always “Professor X proves P=NP” when I would be tempted to write “Professor X claims to prove P=NP”, or even “Professor X has typed some stuff which only he thinks proves P=NP”.

Having spent hours twenty years ago with one of these types of proofs, I don’t feel an obligation to work through more of them.  There are always people out there who do work through things, and find the flaws.   The Geomblog has a nice parody of how the process goes, and that does match up nicely with my experience 20 years ago.  And this post is not an invitation to send me your proof of P=NP or P!=NP!

Despite the “crankiness” that comes from the P(!)=NP papers, I do think good comes out of this work.  For instance, Swart’s paper led to Yannikakis’ very significant result.  And reviewing these papers (once or twice, anyway) is great training for doing referee work in our field.

Thanks to @hakmem whose tweet got me looking at these sites again.

OR Forum Paper on Retailing

The OR Forum (part of the journal Operations Research) has just put out a new paper:  Marshall Fisher on “Rocket Science Retailing”:

In the May-June, 2009 issue of Operations Research, Marshall Fisher, UPS Transportation Professor for the Private Sector at the Wharton School, discusses his experiences with the Consortium for Operational Excellence in Retailing. This paper grew out of Fisher’s 2006 Philip McCord Morse Lecture. From the abstract:

Retailing is a huge industry. In the United States, retail business represents about 40% of the economy and is the largest employer. Retail supply chain management is still more art than science, but this is changing rapidly as retailers begin to apply analytic models to the huge volume of data they are collecting on consumer purchases and preferences. This industry-wide movement resembles the transformation of Wall Street that occurred in the 1970s when physicists and other “rocket scientists” applied their analytic skills to investment decisions.

The Consortium for Operational Excellence in Retailing (COER) (codirected by Ananth Raman, Harvard Business School, and myself) is a group of academics working with about 50 leading retailers to assess their progress towards rocket science retailing and to accelerate that progress through selected research projects.

After some brief comments on the current state of industry practice in retail supply chain management, this paper will describe examples of COER research in four areas: assortment planning, pricing, inventory optimization, and store execution.

There are a couple commentaries on the paper at the website.  Check it out (and feel free to add some comments)!

The Perils of “Statistical Significance”

As someone who teaches data mining, which I see as part of operations research, I often talk about what sort of results are worth changing decisions over.  Statistical significance is not the same as changing decisions.  For instance, knowing that a rare event is 3 times more likely to occur under certain circumstances might be statistically significant, but is not “significant” in the broader sense if your optimal decision doesn’t change.  In fact, with a large enough sample, you can get “statistical significance” on very small differences, differences that are far too small for you to change decisions over.  “Statistically different” might be necessary (even that is problematical) but is by no means sufficient when it comes to decision making.

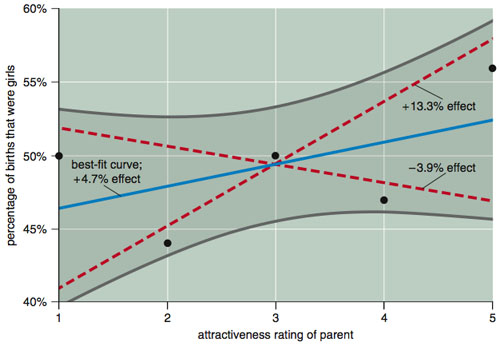
Finding statistically significant differences is a tricky business.  American Scientist in its July-August, 2009 issue has a devastating article by Andrew Gelman and David Weakliem regarding the research of Satoshi Kanazawa of the London School of Economics.  I highly recommend the article (available at one of the authors’ sites, along with a discussion of the article,  and I definitely recommend buying the magazine, or subscribing:  it is my favorite science magazine) as a lesson for what happens when you get the statistics wrong.  You can check out the whole article, but perhaps you can get the message from the following graph (from the American Scientist article):

gelman analysis of Kanazawa

The issue is whether attractive parents tend to have more daughters or sons.  The dots represent the data:  parents have been rated on a scale of 1 (ugly) to 5 (beautiful) and the y-axis is the fraction of their children who are girls.  There are 2972 respondents  in this data.  Based on the Gelman/Weakliem discussion, Kanazawa (in the respected journal Journal of Theoretical Biology) concluded that, yes, attractive parents have more daughters.  I have not read the Kanazawa article, but the title “Beautiful Parents Have More Daughters” doesn’t leave a lot of wiggle room (Journal of Theoretical Biology, 244: 133-140 (2007)).

Now, looking at the data suggests certain problems with that conclusion.  In particular, it seems unreasonable on its face.  With the ugliest group having 50-50 daughters/sons, it is really going to be hard to find a trend here.  But if you group 1-4 together and compare it to 5, then you can get statistical significance.  But this is statistically significant only if you ignore the possibility to group 1 versus 2-5, 1-2 versus 3-5, and 1-3 versus 4-5.  Since all of these could result in a paper with the title “Beautiful Parents Have More Daughters”, you really should include those in your test of statistical significance.  Or, better yet, you could just look at that data and say “I do not trust any test of statistical significance that shows significance in this data”.  And, I think you would be right.  The curved lines of Gelman/Weakliem in the diagram above are the results of a better test on the whole data (and suggest there is no statistically significant difference).

The American Scientist article makes a much stronger argument regarding this research.

At the recent EURO conference, I attended a talk on an aspects of sports scheduling where the author put up a graph and said, roughly, “I have not yet done a statistical test, but it doesn’t look to be a big effect”.  I (impolitely), blurted out “I wouldn’t trust any statistical test that said this was a statistically significant effect”.  And I think I would be right.

IFORS Distinguished Lecturer Christos Papadimitriou

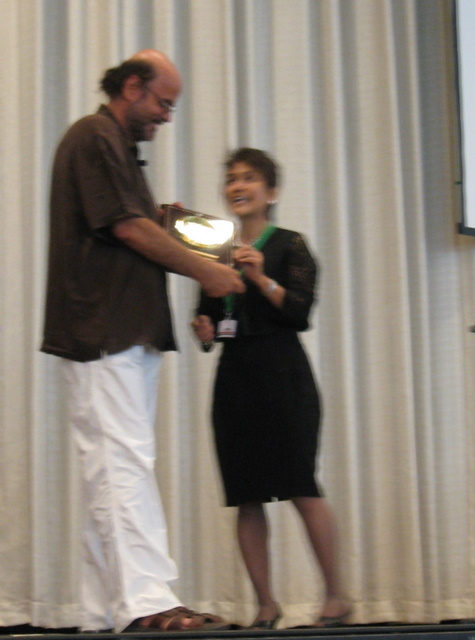
bonn09 034Christos Papadimitriou of UC Berkeley was the IFORS Distinguished Lecturer at the EURO Meeting yesterday (in the fuzzy picture, he is getting his award from IFORS President Elise del Rosario), and gave a very fine lecture on “Computing Equilibria” (and Sex, though that was not in the formal title).   The starting point for his lecture was to note that the internet has greatly increased interest in multi-player games.   Christos described the Internet as the first computational artifact that was never truly designed:  it was formed by the selfish behavior of millions of agents.  To quote Scott Shenker:
The Internet is an equilibrium, we just need to identify the game

But how do players in a game find an equilibrium?  For simple zero-sum games, linear programming can find an equilibrium.  For non-zero sum games, John Nash in 1950 proved an equilibrium exists, but his proof is nonconstructive (and is essentially equivalent to Brouwer’s fixed point theorem).

This issue of finding equilibria often comes up in coffee conversations with my colleagues.  Economists love the beauty of their theorems, but I get frustrated when they claim what they do has real-world relevance when their actors have super-real capabilities.  As Christos quoted:

if your laptop can’t find it, then neither can the market

But, they complain, it is really a bunch of different actors, so perhaps the quote should be “if a million laptops can’t find it, then neither can the market”, but that doesn’t affect things very much.  Given the lack of computational methods for finding equilibrium in any but the simplest games and markets, it seems reasonable to worry about the advisability of relying on the assumption that people in real markets can magically find equilibria.   In fact, Christos has a theorem on price adjustment mechanisms that shows that sometimes these cannot clear markets in anything less than exponential time.

After the romp through computational methods for finding equlibria, Christos moved on to Sex (that should increase my google visibility!).  Why do creatures have sex?  What is the advantage?  Biologists have looked at this problem but don’t have a really satisfactory solution to it.  Christos was motivated by his experience with computational methods for optimization:

Why do Simulated Annealing algorithms work, while Genetic Algorithms don’t?

Audible gasps came from the sizable group of GA researchers in the audience.  I’ll remind readers this is Christos’ view not mine (though I certainly believe that anyone doing work on GAs for the traveling salesman problem, as an example, who believes they are helping solve TSPs is misguided, but I have seen applications where GAs seem the right approach).

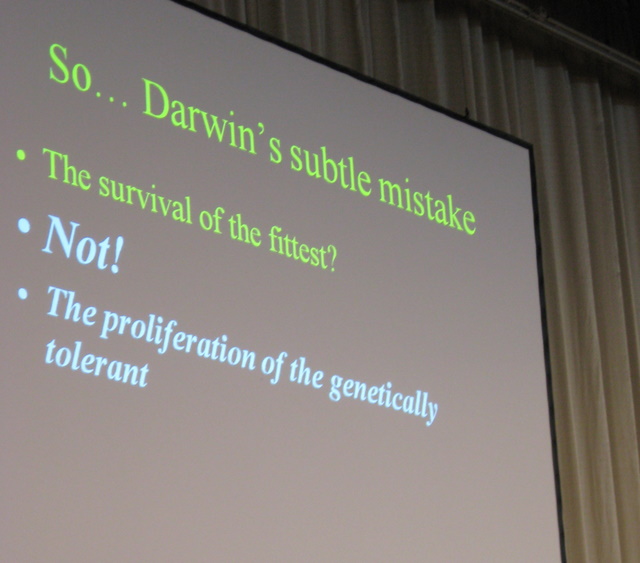
bonn09 032Christos’ fundamental point is that perhaps selection under recombination does not maximize fitness.  Instead, it favors “mixability” (or genetic tolerance).  And this mixability accelerates speciation, and accelerates evolution.   There is a paper in the Proceedings of the National Academy of Science that explains this all in more detail.

Christos’ home page has lots of the papers that underlie the talk (see, particularly, the “computing equilibria” and “biology” subsections).  Highly recommended!