Maybe Analytics is not the Future for Operations Research

There is a lot of discussion on the role the word “analytics” should play in operations research. As a field, we have always had a bit of an identity issue. Perhaps “analytics” is the way we should go. Generally, I am supportive of this: I am part of a group that put together a “Business Analytics” track for my business school’s MBA program, and am delighted with how it resonates with both students and employers.
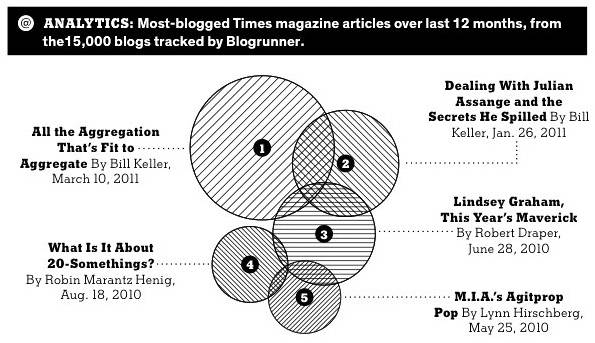
NY Times Most BloggedThen, there are times where I feel we should run away screaming. Today’s New York Times Magazine continues its “Analytics” graphics with a diagram on its most blogged articles. I include a local copy here, for I truly hope that a New York Times editor will feel sufficiently chagrined to remove it from the website and, ideally, from the memory of any who gazed at it.

First, the New York Times has decided to show this as a form of a Venn Diagram.  In this case, intersections should mean something.  What would they mean?  Since the underlying statistic is something like “blogs that mention the article”, presumably the intersection is blogs that mention both articles (or more if multiple circles intersect).  But is this even possible?  It appears that no blog mentions 4 articles (really?  there is no blog covering essentially all of what the New York Times is doing?), and the only 3 articles mentioned by 3 blogs are articles 1, 2, and 3 (unless maybe there is an intersection with 4, 5, and 6:  the diagram is not clear).  Is that even remotely possible?   There seem to be lots of blogs that mention 2 of the articles.   I can’t believe that there is no blog that covered both #1 (“aggregation”) and #4 (“20 year olds”), particularly since there were blogs that covered each along with #3 (“Lindsey Graham”).  The convenience of putting the circles from #1 down to #5 seems to have trumped any realistic representation of the intersections.

Second, this is supposed to be coverage of the last 12 months.  But #1 has been out about 6 weeks, while #5 has been out almost a year.  Is this raw data or is corrected for the different amount of time out?  There is certainly no clue from the graphic.

Third, while there is often controversy over the space needed to graphically display relatively little data, here is a great example where much of the data is not even shown!  The graphic says that it is based “from the 15,000 blogs tracked by Blogrunner”, but shows nothing about how often each article was blogged.  All we get are the relative values, not the absolutes.  And did they do the graph relative to radius or area?  You would hope area, but without the base data, there is no checking.

If this is what “Analytics” is, then operations research should have nothing to do with it.  And the New York Times Magazine editorial team had better think long and hard if they are qualified to put out “analytics” results in their otherwise admirable magazine.

Algorithmic Pricing

900,000,000 bookThe Twitterverse is giggling over some of the absurd pricing for some used books at Amazon (Panos Ipeirotis and Golan Levin were two  who tweeted on the subject).  There are books at Amazon where the price is in the millions of dollars!  How can such a thing happen?

While I love the picture of an eager seller (“I have just two books for sale, but, man, if I sell one, I am set for life!”), the explanation is much more mundane, at least in some cases. As the “it is NOT junk” blog shows, it is clear that two sellers of the book The Making of a Fly (a snip at a price height of a mere $23 million) are setting their price relative to each others price.  Seller A sets its price equal to .99830 times that of seller B;  B sets its equal to 1.27059 of A.  Every day the price of the book goes up by a factor of 1.26843.  Do this for a few months, and you’ll get prices in the millions.

This sort of market driven pricing is not unreasonable.  Sellers with good reputation are able to command higher prices (see, for instance, the paper by Ghosth, Ipeirotis, and Sundararajan on “Reputation Premiums in Electronic Peer-to-Peer Markets” for results and references). A firm might well feel that its reputation is worth a premium of 27.059%. Another firm might adopt an alternative strategy of just undercutting the competition by, say .0017%. Everything works fine until they become the only two firms in a market. Then the exponential growth in prices appears since there is no real “market” to base their differential on.

Such an issue would be nothing more than an amusing sideline if it weren’t for the effect such algorithmic prices can have on more important issues than obscure used books. The “flash crash” of the stock market in 2010 appears to have been caused by the interaction between one large sale and automated systems that executed trades based on trading volumes, not price. As the SEC report states:

“… under stressed market conditions, the automated execution of a large sell order can trigger extreme price movements, especially if the automated execution algorithm does not take prices into account. Moreover, the interaction between automated execution programs and algorithmic trading strategies can quickly erode liquidity and result in disorderly markets.”

Pricing based on markets abound.  At the recent Edelman competition, one of the groups (InterContinental Hotels Group) discussed a price-setting mechanism that had, as one of the inputs, the competing prices in the area. Fortunately, they had a “human in the loop” that prevents spiraling prices of the form seen at Amazon.

In a wish to be quick, there is great pressure to move to automated pricing. Until we create systems that are more robust to unforeseen situations, we risk having not just $900,000,000 books, but all sorts of “transient” effects when systems spin out of control.  And these effects can cause tremendous damage in a short period of time.

Statistics, Cell Phones, and Cancer

Today’s New York Times Magazine has a very nice article entitled “Do Cellphones Cause Brain Cancer”. The emphasis on the article is on the statistical and medical issues faced when trying to find such a link. On the surface, it seems unlikely that cellphones have a role here. There has been no increase in brain cancer rates in the US over the time you would expect if you believe cellphones are a problem:

From 1990 to 2002 — the 12-year period during which cellphone users grew to 135 million from 4 million — the age-adjusted incidence rate for overall brain cancer remained nearly flat. If anything, it decreased slightly, from 7 cases for every 100,000 persons to 6.5 cases (the reasons for the decrease are unknown).

If it wasn’t for the emotion involved, a more reasonable direction to take would be to study why cellphones protect against brain cancer (not that I believe that either!).

This “slight decrease” is then contrasted in a later study:

In 2010, a larger study updated these results, examining trends between 1992 and 2006. Once again, there was no increase in overall incidence in brain cancer. But if you subdivided the population into groups, an unusual pattern emerged: in females ages 20 to 29 (but not in males) the age-adjusted risk of cancer in the front of the brain grew slightly, from 2.5 cases per 100,000 to 2.6.

I am not sure why 7 down to 6.5 is “slight” but 2.5 to 2.6 is “unusual”. It does not take much experience in statistics to immediately dismiss this: the test divides people into males and females (2 cases), age in 10 year groupings (perhaps 8 cases), and area of brain (unclear, but perhaps 5 cases). That leads to 80 subgroups. It would be astonishing if some subgroup did not have some increase. If this is all too dry, might I suggest the incomparable xkcdIf you test lots of things, you will come up with “significant” results.

Even if the 2.5 to 2.6 was “true”, consider its implications: among women in their 20s, about 4% of the occurrences of a rare cancer are associated with cell phone usage. This association would not be among men, or women 30 years or older or under 20. I am not sure who would change their actions based on this:  probably not even those in the most at risk group!

And there are still a large number of caveats: the causation might well be associated with something other than cell phone usage. While statistical tests attempt to correct for other causes, no test can correct for everything.

There are other biases that can also make it difficult to believe in tiny effects. The article talks about recall bias (“I have brain cancer, I used my phone a lot: that must be issue!”):

some men and women with brain cancer recalled a disproportionately high use of cellphones, while others recalled disproportionately low exposure. Indeed, 10 men and women with brain tumors (but none of the “controls”) recalled 12 hours or more of use every day — a number that stretches credibility.

This issue is complicated by a confusion about what “causes” means. Here is a quick quiz: Two experiments A and B both show a significant increase in brain cancer due to a particular environmental factor. A had 1000 subjects, B had 10,000,000 subjects. Which do you find more compelling?

Assuming both tests were equally carefully done, test A is more alarming. With fewer subjects comes a need for a larger effect to be statistically significant. Test B, with a huge number of subjects, might find a very minor increase; Test A can only identify major increases.  The headline for each would be “X causes cancer”, but the impact would be much different if Test A shows a 1 in 50 chance and test B shows a 1 in a million chance.

With no lower bound on the amount of increase that might be relevant, there is no hope for a definitive study: more and larger studies might identify an increasingly tiny risk, a risk that no one would change any decision about, except retrospectively (“I had a one in a zillion chance of getting cancer by walking to school on June 3 last year. I got cancer. I wish I didn’t walk to school.”). It certainly appears that the risks of cell phone usage are very low indeed, if they exist at all.

There is no doubt that environmental factors increase the incidence of cancer and other health problems. The key is to have research concentrate on those that are having a significant effect. I would be truly astonished if cell phones had a significant health impact. And I bet there are more promising things to study than the “linkage” between cell phones and cancer.

IBM, Ralph Gomory and Business Analytics

Had a post at the INFORMS Conference site on Ralph Gomory:

For those of us taking a break from the INFORMS conference, the Master’s golf tournament holds special attention. Not for the golf (though the golf is wonderful), but for the commercials. Practically every commercial break has an IBM commercial featuring some of its luminaries from the past. Prominent among them is Ralph Gomory. Everyone in operations research knows of Ralph. For the optimization-oriented types, he is the Gomory of Gomory cuts, a fundamental structure in integer programming. For the application-oriented types, he was the long-time head of research for IBM. For the funding and policy-oriented types, he was the long-time head of the Alfred P. Sloan Foundation supporting analysis on globalization, technology, and education. Great career, when you can be highly influential three different ways (so far)!

During his time at IBM, Ralph stressed the need for research and development to work together. This view that research should be grounded in real business needs is one that I think has greatly strengthened areas such as operations research and business analytics. While there is no dearth of theoretical underpinnings in these areas, the fundamental research is better by being guided by practical need. This has led to the insights that give us fast optimization codes, stronger approaches to risk and uncertainty, and the ability to handle huge amounts of data.

There is a full version of the IBM video that lasts about 30 minutes (currently on the front of their Smarter Planet page). Ralph shows up in the introduction, then around 24:43 in an extended discussion of the relationship between research and business need, and again near the end (30:08).

This conference would have been a lot different (and less interesting) without the career of Ralph as a researcher, executive and foundation leader. We are lucky he began in operations research.

INFORMS Sponsorship of OR-Exchange

OR-Exchange has been a question and answer site on operations research in existence for about two years. Over that time, there have been 290 questions, generating more than 1000 answers. You have a question? Chances are there is someone there to answer!

Coinciding with the newly revamped INFORMS Conference on Business Analytics and Operations Research is the INFORMS sponsorship of OR-Exchange. Conversion to new software and the INFORMS computing system has gone smoothly over the past few days (thanks David!), and we are excited about the new opportunities that come with INFORMS support.

In keeping with the renaming of the conference, we’ve also changed the tagline for OR-Exchange. We are now “Your place for questions and answers in operations research and analytics”.

Getting ready for INFORMS Business Analytics and OR conference

I’m getting ready for next week’s INFORMS Conference on Business Analytics and Operations Research. Looks like the renaming (from the INFORMS Practice Conference) has had an effect: the conference has gotten record registration (more than 600).

Getting ready for a conference is not just tossing some clothes in a suitcase. Keeping up my social networking responsibilities is a lot of work! I’ve changed my blog page to highlight the feed from the INFORMS Conference blog (where I will guest blog for a few days). We’ve started a discussion on the appropriate twitter-tag (I like #baor11). I’ve contacted some friends for suggestions of a brewpub to visit (Goose Island on Clybourn seems to be a good choice). Above all that, I have to read (thoroughly!) the papers associated with the Edelman competition, where I am a judge.

I have done my first post for the INFORMS Blog. Here is what I wrote:

I fly out to the Analytics conference in a few days. By some weird happenstance, I have never flown with Southwest before, but I am doing so on Saturday. In view of the issues Southwest is having, I need to do a bit of risk analysis. I really wish I could attend the risk analysis track before I get on the plane, instead of after I arrive.

Fortunately, Arnie Barnett (operations research go-to guy for aviation risk analysis) has provided insight into the risks. I think I’ll be OK with Southwest.

Puppetry, Turf Management, and Operations Research

CNN and careerbuilder.com have put out a list of six unusual college degrees. I checked it out, expecting to see Carnegie Mellon’s own offering in this area: bagpiping. But bagpiping was not unusual enough to make this list. After possibilities for racetrack management and packaging (“Don’t think outside the box: think about the box”), there was one appealing one nestled between puppetry and turfgrass management: “decision making”. At the Kelly School at the University of Indiana, you can get a doctorate in “help[ing] future business leaders analyze and make decisions.” Wow!

Of course, this is just our favorite field of Operations Research, weakly disguised with a fake mustache and beard:

According to the program’s website, “Decision Sciences is devoted to the study of quantitative methods used to aid decision making in business environments. Using mathematical models and analytical reasoning, students examine problems … and learn how to solve these problems by using a number of mathematical techniques, including optimization methods (linear, integer, nonlinear), computer simulation, decision analysis, artificial intelligence and more.”

In our never-ending quest to find the right name for our field, we are showing up on lists of wacky degrees, displacing bagpiping and cereal science (“Ingrain yourself to a great career”). Better that than being on no lists at all. Maybe a prospective puppeteer will see the list and decide to go into “decision making” instead. No strings attached.

Thanks to Kevin Furman for the pointer!