Everyone Needs to Know Some Statistics Part n+1

I have previously written on how decision makers (and journalists) need to know some elementary probability and statistics to prevent them from making horrendously terrible decisions.  Coincidentally, Twitter’s @ORatWork (John Poppelaars) has provided a pointer to an excellent example of how easily organizations can get messed up on some very simple things.

As reported by the blog Bad Science, Stonewall (a UK-based lesbian, gay and bisexual charity) released a report stating that the average coming out age has been dropping.  This was deemed a good enough source to get coverage in the Guardian. Let’s check out the evidence:

The average coming out age has fallen by over 20 years in Britain, according to Stonewall’s latest online poll.

The poll, which had 1,536 respondents, found that lesbian, gay and bisexual people aged 60 and over came out at 37 on average. People aged 18 and under are coming out at 15 on average.

Oh dear!  I guess the most obvious statement is that it would be truly astounding if people aged 18 and under had come out at age 37!    Such a survey does not, and can not (based just on that question), answer any questions about the average coming out age.  There is an obvious sampling bias:  asking people who are 18 when they come out ignores gays, lesbians, and bisexuals who are 18 but come out at age 40!  This survey question is practically guaranteed to show a decrease in coming out age, whether it is truly decreasing, staying the same, or even increasing.  How both the charity and news organizations who report on this can’t see this immediately baffles me.

But people collect statistics without considering whether the data address the question they have.  They get nice reports, they pick out a few numbers, and the press release practically writes itself.  And they publish and report nonsense.  Bad Science discusses how the question “Are people coming out earlier” might be addressed.

I spent this morning discussing the MBA curriculum for the Tepper School, with an emphasis on the content and timing of our quantitative, business analytics skills.  This example goes to the top of my “If a student doesn’t get this without prodding, then the student should not get a Tepper MBA” list.

Added December 2. Best tweet I saw on this issue (from @sarumbear):

#Stonewall ‘s survey has found that on average, as people get older, they get older. http://bit.ly/gT731O #fail
Eating Better and Better Routing

For the last year or so, my wife and I have decided to eat better by doing more “real” cooking.  A great help in this has been a magazine “Real Simple“.  Every month, the magazine publishes a series of recipes, each generally requiring only 20-30 minutes of preparation time.  We like these recipes because they use real ingredients:  none of this “Pour a can of cream of celery soup over everything”.  We’ve agreed to cook everything, whether it sounds appealing or not, and of the dozens of recipes we have gone through, essentially all of them were edible, with most very good and a few definite keepers (*).   The authors of the recipes do seem to have a fondness for leeks and fennel, but we have grown used to that.   Alexander, my six year old son, eats the same food of course, and generally approves of what we are cooking.

I was delighted with this month’s issue where they had a short blurb on the website route4me.com.  The description appeals to their readership:

You need to get to the library before closing, but you also have to pick up the dry cleaning, the kids from school (don’t forget that one), and the inevitable snack along the way.  Enter up to 10 addresses on this site and it will calculate the shortest route to get it all done, complete with driving directions.

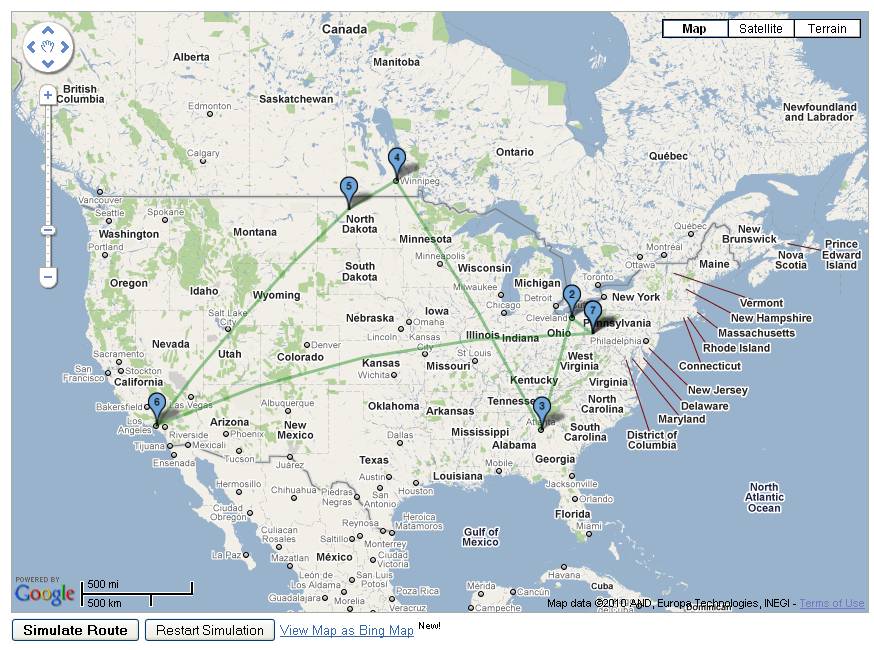
The Traveling Salesman Problem makes an appearance in our cooking magazine!  Naturally I went over to the site, and checked it out by putting in a few cities (seems a limit of 6 but maybe signing up gets you more): Pittsburgh, Cleveland, Atlanta, Winnipeg, Minot (ND), and Los Angeles.  Clicked “round trip” to get back home and ended up … with a somewhat surprising route:

Hmm… that crossing in Illinois is a little suspicious.  This doesn’t look like the optimal route.  Is it? Maybe it is hard to get from Cleveland to Winnipeg due to the lakes?  Perhaps here was an example were the underlying road network really has a strong effect on the optimal tour.

I checked things out, and compared this route to the route going from Pittsburgh-Cleveland-Winnipeg-Minot-LA-Atlanta-Pittsburgh.  Turns out the route from route4me is about 10 hours (driving) longer than the crossing-free route.  What kind of optimization is this?

It took a bit more playing around before I figured out what route4me was doing.  Their definition of a “round trip” is the minimum path visiting all the cities from the starting point, followed by going from the final city back to the starting point.    The best path is Pittsburgh-Cleveland-Atlanta-Winnipeg-Minot-LA;  they then just add in the LA-Pittsburgh leg.  Kind of a funny definition, but I am sure they document it someplace.

Overall, I think I will stick with Real Simple for telling me how best to prepare kale, and leave the traveling salesman information to other sources.

[Thanks to Ilona for pointing out the blurb in the magazine.]

(*)  Our favorite recipe so far has been “Scallops with Sweet Cucumber and Mango Salsa”.  Call it the official recipe of Michael Trick’s Operations Research Blog!

Serves 4 Hands-On Time: 25m Total Time: 25m

Ingredients

  • 1 cup long-grain white rice (such as jasmine)
  • 2 mangoes, cut into 1/2-inch pieces
  • 2 Kirby cucumbers or 1 regular cucumber, peeled and cut into 1/2-inch pieces
  • 1 tablespoon grated ginger
  • 2 teaspoons fresh lime juice
  • 2 tablespoons extra-virgin olive oil
  • 1/2 cup fresh cilantro, chopped
  • kosher salt and pepper
  • 1 1/2 pounds large sea scallops

Directions

  1. Cook the rice according to the package directions.
  2. Meanwhile, in a medium bowl, combine the mangoes, cucumbers, ginger, lime juice, 1 tablespoon of the oil, the cilantro, 1/2 teaspoon salt, and 1/8 teaspoon pepper; set aside.
  3. Rinse the scallops and pat them dry with paper towels. Season with 1/4 teaspoon salt and 1/8 teaspoon pepper. Heat the remaining oil in a large skillet over medium-high heat. Add the scallops and cook until golden brown and the same color throughout, about 2 minutes per side. Divide among individual plates and serve atop the rice with the salsa.

Correction… Operations Research is Not Taking Over the World, Yet

After trumpeting the glorious news that Japan had an operations research-educated Prime Minister, I suppose I should note that Prime Minister Yukio Hatoyama is resigning after eight months of rule.  With operations research in his arsenal, perhaps he simply fixed everything in those eight months.  But that does not appear to be the case (according to CNN):

In his first speech as Japan’s 92nd prime minister, Hatoyama made promises that he would conduct a clean and transparent government, launching a task force to monitor government spending.

But soon afterwards, allegations of illegal campaign financing tarnished his administration’s image. Some of his cabinet members were investigated for corruption.

His approval rating took further hits over his failed promise to move a major U.S. Marine base off Okinawa to ease the burden of the island, which hosts the majority of the United States military presence in Japan. Earlier this month, calling his decision “heartbreaking,” he announced that the base would remain on Okinawa, although relocated to a different part of the island.

C’mon Yukio, it is a facility location problem!  We’ve been solving those for decades!

Let’s hope the less-than-stellar past eight months don’t tarnish all of us in operations research who aspire to higher office.

[Thanks to my former doctoral student Ben Peterson who called me out on this issue.]

Optimizing Discounts with Data Mining

The New York Times has an article today about tailoring discounts to individuals.    They concentrated on Sam’s Club, a warehouse chain.  Sam’s Club is a good place for this sort of individual discounting since you have to be a member to shop there, and your membership is associated with every purchase you make.  So Sam’s Club has a very good record of what you are buying there.  (In fact, as a division of Walmart Stores, perhaps Sam’s has an even better picture based on the other stores in the chain, but no membership card is shown at Walmart, so it would have to be done through credit card or other information.)

The article stressed how predictive analytics could predict what an individual consumer might be interested in, and could then offer discounts or other messages to encourage buying.

Given how many loyalty cards I have, it is surprising how few really take advantage of the data they get.  Once in a while, my local supermarket seems to offer individualized coupons.   Barnes and Noble and Borders seem to offer nothing beyond “Take 20% of one item” coupons, even though everything in my buying behavior says “If you hook me on a mystery or science fiction series, I will buy each and every one of the series, including those that are only in hardcover”.

Amazon does market to me individually, seeming to offer discounts that may be designed for me alone (online retailers can hide individual versus group discounts very well:  it is hard to know what others are seeing).

For both Sam’s and Amazon, though, I would be worried that the companies would be using my data against me.  If the goal is to optimize net revenue, any optimal discounting scheme would have the following property:  if I am sufficiently likely to buy a product without a discount, then no discount should be given.  The NY Times article had two quotes from customers:

“There’s a dollar off Bounce. I use that all the time.”

and

“[A customer]  said the best eValues deal yet was $300 off a $1,200 television.

“I remember that day,” he said later. “I came to buy food, and I bought two TVs.”

The second story is a success for data mining (assuming the company made a profit off of a $900 TV):  the customer would not have purchased without it.

In the first first story, the evaluation is more complicated:  if she really was going to buy Bounce anyway, then the $1 coupon was a $1 loss for Sam’s.  But consumer behavior is complicated:  by offering small discounts on many items, Sam’s encourages customers to buy all of their items there, not just the ones on discount.  So the overall effect may be positive.  But optimal discounting for these sorts of interrelated items with a lifetime environment is pretty complicated.

But here is a hypothetical situation (presumably):  it turns out that 25 year olds (say) are at a critical point in purchasing behavior when they decide exactly what brands they will purchase for the rest of their lifetime;  50 year olds are set in their ways (“I always buy Colgate, I never buy Crest”).  A 25 year old goes into Sam’s, hits the kiosk and walks away with 10 pages of coupons;  a 50 year old gets nothing.  Is this a success for data mining?  Perhaps the answer depends on whether you are 25 or 50!

And, more importantly for me, does Amazon not give me discounts once it is sufficiently certain I am going to want a book?

Journalists Should Be Required to Pass an Exam on Conditional Probability

There is nothing more grating than having a journalist toss around numbers showing no understanding of conditional probability (actually, there are 12 more grating things, but this ranks right up there).  In a nice story from NBC Chicago, journalists Dick Johnson and Andrew Greiner write about an autistic teen who has picked the first two rounds of the NCAA tournament correctly:

An autistic teenager from the Chicago area has done something almost impossible.

Nearly 48 games into an upset-filled NCAA tournament, 17-year-old Alex Herrmann is perfect.

“It’s amazing,” he says. Truly.

Yes it is amazing. But the writers get tripped up when trying to project the future:

There are still four rounds remaining, so it could fall apart — the odds of a perfect wire to wire bracket is about 1 in 35,360,000 by some measures or 1 in 1,000,000,000,000 by others.

Aaargh! Let’s let pass the factor of 28,000 or so difference in estimates. THIS IS NOT THE RELEVANT STATISTIC! We already know that Alex has picked the first two rounds correctly. We are interested in the probability he has a perfect bracket given he picked the first 48 games correctly. This is about the simplest version of conditional probability you can get.

If all he did was flip a coin for each of the remaining 15 games, he would have a one in 32,768 chance of having a perfect bracket, given where he is now. Not great odds, certainly but nothing like the probabilities given in the quote. You can argue whether 50/50 on each the fifteen remaining games is the right probability to use (Purdue as champion?), but there is absolutely no justification for bringing in the overall probability of a perfect bracket.  By quoting the unconditional probability (and who knows where those estimates come from), the writers vastly underestimate Alex’s chance of having a perfect bracket.

I swear I see the confusion between unconditional probabilities and conditional probabilities twice a day. I suspect the stroke that will finally get me will be caused by this sort of error.

Edit.  9:06PM March 23. From the comments on the original post, two further points:

  1. The writers also seem confused about joint probabilities:
  2. One in 13,460,000, according to BookofOdds.com. It’s easier to win the lottery. Twice.

    No… not unless your lottery has the probability of winning of one in the square root of 13,460,000, or one in 3669. While there are “lotteries” with such odds, the payoffs tend to be 1000 to 1, not millions to 1. I bet they thought winning one lottery might be 1 in 7,000,000 so two lotteries “must be” 1 in 14,000,000. No, that is not the way it works.

  3. It appears that if you manage a pool on cbs.sportsline.com, you can edit the picks after the games. That might be a more reasonable explanation for picking 48 games, but it is hard to tell.

So, to enumerate what journalists should be tested on, lets go with:

  1. Conditional Probability
  2. Joint Probabilities
  3. Online editing possibilities

You are welcome to add to the certification test requirements in the comments.

March Madness and Operations Research, 2010 Edition

Normally I do a long post on operations research and predicting the NCAA tournament.  I did so in 2009, 2008, 2007 and even in 2006 (when I think I made blog entries with an IBM selectric typewriter).   This year, I will cede the ground to Laura McLay of Punk Rock Operations Research, who has a very nice series of OR related entries on the NCAA tournament (like this post and the ones just previous to it).  I’d rather read her work than write my own posts.

That said, perhaps just a comment or two on Joel Sokol (and his team)’s LRMC picks, as covered in the Atlanta Business Chronicle.  Joel’s ranking (LRMC stands for Logistic Regression Markov Chain) can be used to predict winners.  They have a page for their tournament picks.  Some notable predictions:

1) Their final 4 consists of 3 number 1’s (Kansas, Syracuse, and Duke) and one number 2 (West Virginia).  The remaining number 1 is Kentucky, ranked only number 9 overall by LRMC.

2)  Kansas beating Duke is the predicted final game.

3) 7th seeded BYU is ranked 4th overall, so makes the Elite Eight until knocked off by Syracuse (3).

4) 12th seeded Utah State is predicted to beat 5th seeded Texas A&M and 4th seeded Purdue.

5) 13th seeded Murray State over 4th seeded Vanderbilt is the biggest predicted first round upset.

Let’s see how things turn out.

The Magical Places Operations Research Can Take You

Art Benjamin of Harvey Mudd College has an article in this week’s Education Life section of the New York Times where he gives ten mathematical tricks.

I first met Art in the late 80s at, I believe, a doctoral colloquium sponsored by ORSA/TIMS (now INFORMS). Art was clearly a star: he won the Nicholson Prize (Best Student Paper) in 1988. If he had stuck with the “normal path” of being an academic researcher, I have no doubt that he would now be well known in operations research academia.

But his real passion was lightning calculation and other forms of mathematical magic and in keeping with that path, he has made himself even better known to a much broader audience. He has published three books aimed at the general audience, including one that was a Book-of-the-Month Club selection (is this unique in operations research?). He has an amazing act that he performs for a wide range of audiences.

His research has moved out of operations research  into combinatorics and combinatorial games (though these areas have a lot of overlap with OR), where he publishes prolifically and has two books aimed at professionals. His book “Proofs that Really Count” (along with Jennifer Quinn) is a great introduction to combinatorial proofs.

Art is another example of the variety of paths you can take after an operations research degree.

Probability, Mammograms, and Bayes Law

The New York Times Magazine Ideas Issue is a gold mine for a blogger in operations research. Either OR principles are a key part of the idea, or OR principles show why the “idea” is not such a great idea after all.

One nice article this week is not part of the “ideas” article per se but illustrates one key concept that I would hope every educated person would understand about probability. The article is by John Allen Paulos and is entitled “Mammogram Math”. The article was inspired by recent controversy on recommended breast cancer screening. Is it worth screening women for breast cancer at 40 or should it be delayed to 50 (or some other age)? It might appear that this is a financial question: is it worth spending the money at 40 or should we save money by delaying to 50. That is not the question! Even if money is taken out of the equation, it may not be a good idea to do additional testing. From the article:

Alas, it’s not easy to weigh the dangers of breast cancer against the cumulative effects of radiation from dozens of mammograms, the invasiveness of biopsies (some of them minor operations) and the aggressive and debilitating treatment of slow-growing tumors that would never prove fatal.

It would seem to have an intelligent discussion on this, there are a few key facts that are critical. For instance: “Given a 40 year old woman has a positive reading on her mammogram, what is the probability she has treatable breast cancer?” Knowing a woman of roughly that age, I (and she) would love to know that value. But it seems impossible to get that value. Instead, what is offered are statistics on “false positives”: this test has a false positive rate of 1%. Therefore (even doctors will sometimes say), the probability of a woman with a positive reading is 99% likely to have breast cancer (leaving the treatable issue by the side, though it too is important). This is absolutely wrong! The article gives a fine example (I saw calculations like this 20 years ago in Interfaces with regards to interpreting positive drug test results):

Assume there is a screening test for a certain cancer that is 95 percent accurate; that is, if someone has the cancer, the test will be positive 95 percent of the time. Let’s also assume that if someone doesn’t have the cancer, the test will be positive just 1 percent of the time. Assume further that 0.5 percent — one out of 200 people — actually have this type of cancer. Now imagine that you’ve taken the test and that your doctor somberly intones that you’ve tested positive. Does this mean you’re likely to have the cancer? Surprisingly, the answer is no.

To see why, let’s suppose 100,000 screenings for this cancer are conducted. Of these, how many are positive? On average, 500 of these 100,000 people (0.5 percent of 100,000) will have cancer, and so, since 95 percent of these 500 people will test positive, we will have, on average, 475 positive tests (.95 x 500). Of the 99,500 people without cancer, 1 percent will test positive for a total of 995 false-positive tests (.01 x 99,500 = 995). Thus of the total of 1,470 positive tests (995 + 475 = 1,470), most of them (995) will be false positives, and so the probability of having this cancer given that you tested positive for it is only 475/1,470, or about 32 percent! This is to be contrasted with the probability that you will test positive given that you have the cancer, which by assumption is 95 percent.

This is incredibly important as people try to speak intelligently on issues with statistical and probability aspects. People who don’t understand this really have no business having an opinion on this issue, let alone being in a position to make medical policy decisions (hear me politicians?).

Now, I have not reviewed the panel’s calculations on mammogram testing, but I am pretty certain they understand Bayes Law. It makes sense to me that cutting down tests can make good medical sense.

Stephen Baker, ex-Business Week

Stephen Baker, a senior writer at Business Week, is part of the group that was not offered a job after that magazine was bought by Bloomberg. Steve’s journalism has been a tremendous boon to the world of operations research. His cover story “Math will Rock Your World” pointed out all the ways mathematics is affecting business and even mentioned operations research by name. He attended our conferences, and worked some of our stories into the bestselling book “The Numerati”.

So what is with the new Business Week? If I can quote Steve about trying to sell the world we live in to the mainstream business press:

At the O.R. conference (the association is called INFORMS), there were far too many interesting presentations for one person to cover them all. The people behind operations at Intel, IBM, the Army, Ford and plenty of others provided inside looks. Beat reporters of those companies could have feasted on these lectures. But they weren’t there.

Why? The press covers news, stocks, companies and personalities. But try pitching a cover story on operations. People think it’s … boring.

Baker goes on to explain why it is really not boring and is really important. But the Bloomberg people obviously didn’t read far enough or weren’t creative enough to understand what Baker provides.

I’m pretty darn confident that Steve will end up OK (or better than OK!): he is a fine writer and an intelligent man (if you have a job for him, run and get him: here is his resume). I am much less confident how Business Week will end up.

Without Operations Research, Gridlock!

In many applications, it can be difficult to measure the effect of an operations research project.  For instance, my colleagues and I provide schedules for Major League Baseball.  What is the value added by the operations research we do?  MLB doesn’t have the time, energy or money to handle multiple schedulers in parallel:  they decided five or so years ago that they liked our schedules, and they have been using us since.  We have gotten better over time.  What is the value now?  Who knows?  The non-operations research alternatives no longer provide schedules, and the process, in any case, was not “here’s a schedule, evalute it!”:  it is much more interactive.

gridlockOnce in a while, circumstances come together to show the value of operations research.  If you have been trying to drive anywhere in Montgomery County, Maryland (northwest of Washington, D.C.), you have had a chance to see how traffic systems work without the coordinating effect of operations research systems.  A computer failure messed up the synchronization of traffic signals.  From a Washington Post article:

A computer meltdown disrupted the choreography of 750 traffic lights, turning the morning and evening commutes into endless seas of red brake lights, causing thousands of drivers to arrive at work grumpy and late, and getting them home more frustrated and even later.

The traffic signals didn’t stop working.  They continued, but they no longer changed the time spent “green” in each direction based on time, and they no longer coordinated their “green” cycles along the main corridors:

The system, which she described as “unique” in the Washington region, is based on a Jimmy Carter-era computer that sends signals to traffic lights all over the county. On weekday mornings, it tells them to stay green longer for people headed to work. And in the evenings, it tells them to stay green longer for people headed home.

It also makes them all work together — green-green-green — to promote the flow of traffic. That happens automatically, and then the engineers use data from hundreds of traffic cameras and a county airplane to tweak the system. When there is an accident, breakdown or water main break, they use the computer to adjust signal times further and ease the congestion around the problem.

It’s great when it works, a disaster when it fails.

Of course, without operations research, which determines the correct times and coordinates it across the network, it would be a disaster all the time.  Here’s hoping they get back to the “optimized world” soon (as seems to be the case).