Another Operations Research Challenge: ROADEF, EURO, and Google

I am a big fan of “challenges” in operations research.  Almost twenty years ago, I ran a DIMACS Challenge on finding cliques, coloring graphs and solving satisfiability problems.  That challenge gave a clear picture of where we were then in those areas and showed the variety of approaches possible for those three problems.  I also  met a large number of people and took pride in creating something useful to many.

ROADEF (the French OR Society) has run a series of Challenges over the years.  These challenges have been inspired by real-world problems and are generally very rich in detail (details on past Challenges, including test instances, are available at the Challenge site).  The recently announced 2012 Challenge is no different.  The problem to be solved comes from Google, and involves assigning jobs to machines.

The aim of this challenge is to improve the usage of a set of machines. A machine has several resources as for example RAM and CPU, and runs processes which consume these resources. Initially each process is assigned to a machine. In order to improve machine usage, processes can be moved from one machine to another. Possible moves are limited by hard constraints, as for example resource
capacity constraints, and have a cost. A solution to this problem is a new process-machine assignment which satisfies all hard constraints and minimizes a given objective cost.

The problem description then goes on for 10 pages, including issues such as locations, services, conflicts, moving costs and much, much more.  This certainly looks like a real problem and one that a firm like Google would need to solve routinely and quickly.  I can also see a number of different approaches that might work.  I look forward to seeing what methods are successful for this.

This Challenge is sponsored by ROADEF, EURO, and Google.  Google, for all its success, has only recently started to use and support operations research (though the line between computer science and operations research is very fuzzy in this area), so I am delighted to see their support of this Challenge.  Now, how about some million dollar prizes to go with it … (though 20,000 euros is not to be sniffed at).

Are you an Undergraduate who has done Great OR?

If you are an undergraduate student who has done great operations research, or know someone like that, note that INFORMS has a prize for great undergraduate work.   The work can be in OR theory or practice, but the judging is based on a paper.  You can find out more information at the INFORMS website.  Better hurry, though:  the due date for submissions is July 1.

On the Shoulders of Giants

Yesterday I was messing around with The Mathematics Genealogy Project and I learned that Anna Nagurney, among others, is a not-so-distant cousin.  That inspired me to shoot off a couple of emails trying to trace my history farther back.

To recap, my advisors were Don Ratliff and John Bartholdi.  John was a student of Don, so Don is both my father and grandfather, a situation that would certainly raise eyebrows outside of academia.  Don’s advisor was Manny Bellmore who did a lot of fundamental work in the late 1960s and 70s on the traveling salesman problem and various other optimization problems.  Manny’s advisor was Frederick (Tom) Sparrow, who did extensive work in energy modeling and policy, among other things.  Bellmore also worked with George Nemhauser, but George was on leave in England when Manny graduated, so Sparrow was the advisor.  It is through Sparrow that I am related to Nagurney.

To continue earlier in history, I shot off an email to Tom, who is emeritus from Purdue.  Fortunately my email got through the spam filters (starting an email “Hello Great-Grandfather” does make it sound like a plea from a Nigerian prince), and he could tell me about his advisors.  He had two  The first was an economist named Kenneth Boulding.  This is a name I should know but do not.  He did some fundamental work in systems science and conflict analysis starting in the mid-1950s with some papers that are incredibly well cited.  When the wikipedia description begins with:

Kenneth Ewart Boulding (January 18, 1910 – March 18, 1993) was an economist, educator, peace activist, poet, religious mystic, devoted Quaker, systems scientist, and interdisciplinary philosopher

it is clear we are talking about someone unusually interesting.

Tom’s other advisor is, however, known to me (as it is to many in operations research):  Merrill Flood (1908-1991).  Flood was a founder of the field of operations research.  He worked on transportation problems in the 1930s and developed the “Northwest Corner” rule for finding a solution to such problems, before Dantzig developed a general method for optimizing these problems.  He also was an early researcher on the game-theory problem Prisoner’s Dilemma.  He was also an influential popularizer of the Traveling Salesman Problem.   He was the second President of TIMS, and he received the Kimball Medal for services to the field (a designation I have the honor to share with him).

Flood happens to be in the Mathematics Genealogy Project (though without listed advisees) and his advisor was Joseph Henry Maclagan Wedderburn (1882-1948), Scottish-born algebraist who taught at Princeton for most of his career.  Wedderburn’s advisor was George Chrystal (1851-1911),  whose advisor was James Clerk Maxwell (1831-1879), father of electromagnetic theory!  Checking out his wikipedia article leads to the immortal verse:

Gin a body meet a body
Flyin’ through the air.
Gin a body hit a body,
Will it fly? And where?

Going back from Maxwell, we get William Hopkins (1793-1866), who combined mathematics with geology.  I love the wikipedia entry on his private life:

Hopkins enjoyed music, poetry and landscape painting. He spent the end of his life in a lunatic asylum in Stoke Newington. He died there of chronic mania and exhaustion.

Perhaps not an unusual ending for mathematicians.

Back from there we get Adam Sedgwick (1785-1873), a founder of geology.  He had two advisors:  Thomas Jones (1756-1807) and John Dawson (1734–1820), a mathematician and surgeon.  Dawson leads to Edward Waring (1736-1798), a Lusasian Professor of Mathematics.

On the Jones side, we get two advisors: John Cranke (1746-1816) and Thomas Postlethwaite (1731-1798).  Fortunately Cranke was the student of Postlethwaite, so we don’t branch (making an already large lineage even bushier).  At this point we hit two Cambridge tutors:  Stephen Whisson (?-1783) and Walter Taylor (c1700-1743).  Taylor was trained by Robert Smith (1689-1768), known as Old Focus for his work in optics.  Smith leads to Roger Cotes (1682-1716), who worked closely with his advisor… Sir Isaac Newton!  That makes Sir Isaac my Great-Great-Great-Great-Great-Great-Great-Great-Great-Great-Great-Great-Great-Grandfather (academically speaking).

From Philosophiæ Naturalis Principia Mathematica to A Dynamical Theory of the Electromagnetic Field to trying to schedule 8 team sports leagues in a mere 15 generations. On the shoulders of giants indeed!

I suspect that if the system was completely filled in, we would all be descendants of Newton.  But I am walking a little taller today, and feeling a bit more pressure in my research, knowing of my illustrious ancestors.

Hello Cousin!

My father has spent time over the last decade collecting pictures and documents related to our family tree.  I greatly appreciate him doing this, and the result is fascinating.  There is no one really famous in my tree, unless you are a follower of (Canadian) prairie socialism, since I think J.S. Woodsworth is in there, by marriage into the Staples family, my father having Staples as a middle name.  But the pictures of past generations are evocative and the stories of families moving from Europe to rural Canada are inspirational.  The bravery in pulling up roots in a world when communication times are measured in weeks or months is unbelievable.  It makes me realize how easy I have had it, and how my own choices are so relatively costless either way.

I addition to real ancestry, there is also academic ancestry, tracing descendents through the academic advisement.  Within operations research (and mathematics more generally), we have a central collection point for academic ancestry:  the Mathematics Genealogy Project.   This site has collected the the advisor/advisee relationships for more than 150,000 mathematicians, including many in operations research.  This site is certainly not new, dating back to 1999 or so 1997, and I have known about it practically since the start.  It is only now, however, that I sent in the information on my own advisors (Don Ratliff and John Bartholdi) and my seven advisees.  It will take a bit of time to update the site.  In the world of Web 2.+, it is strange to have such a delay, but it appears there is still a bit of hand editing.  Soon my tiny part of the tree will be accurate.

For finding my ancestry, the first part is easy:  John Bartholdi was a student of Don Ratliff (starting me on a non-branching family tree), and Don was the student of Manny Bellmore, who also advised now-billionaire John Malone.   Bellmore was the student of Frederick (Tom) Sparrow, a long time faculty member at Purdue.  Looking at Tom’s descendents, I see he was the advisor to Stella Dafermos who advised … fellow OR-blogger, and network guru, Anna Nagurney!  In fact, the picture of Dr. Sparrow comes from Anna’s Virtual Center for Supernetworks. So it turns out that Anna is my … umm… first cousin once removed?  Anyway, we are definitely related, as you can tell by the fact that she writes very well, and I … type things into my blog (generally with too many parentheses and exclamation points!).

I’m continuing to work my way back.  It seems that most people end up back at Gauss, but we’ll see where I end up.  I think I would be more delighted to see that most of operations research blogORsphere comes from close academic relatives!

So What Correlates with Operations Research?

Google Labs has a new tool called Google Correlate. Google provided some early correlation results during the 2008 flu season when it showed that search count for certain terms (like “flu” presumably) could be used to estimate the prevalence of flu in an area.  This led to Google Flu Trends (it appears that currently only South Africa has many cases of the flu).

You can now play this game on your own data.  Have a time series over the last 9 years or so?  You can enter it into Google Correlate and see what search terms are correlated with the data.

Even easier is just entering a search term:  it will then return other correlated search terms.

If you are going to periodically write in something called “Michael Trick’s Operations Research Blog”, it is clear what to do next:  search on “Michael Trick” (it is required to egotistically search on your own name first, right?).  No dice:  I’m not popular enough to justify a search (sigh…).

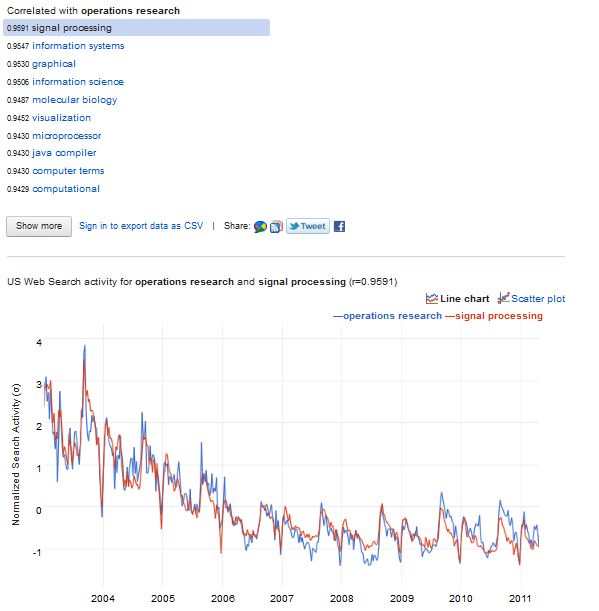
But, of course, “operations research” works fine.  What  correlates with that phrase?  Turns out lots of interesting things:  “signal processing”, “information systems”, and … “molecular biology”?  What are the common features on these terms?  Well, they were relatively more common search terms in 2004-2005, relatively flat in the past three years, and have a strong seasonality, corresponding to the start of the academic year (“Hey, I signed up for Operations Research:  what the heck is that?”).  Whether it is operations research, signal processing or molecular biology, it appears lots of academic departments begin September with students frantically searching on their subjects.

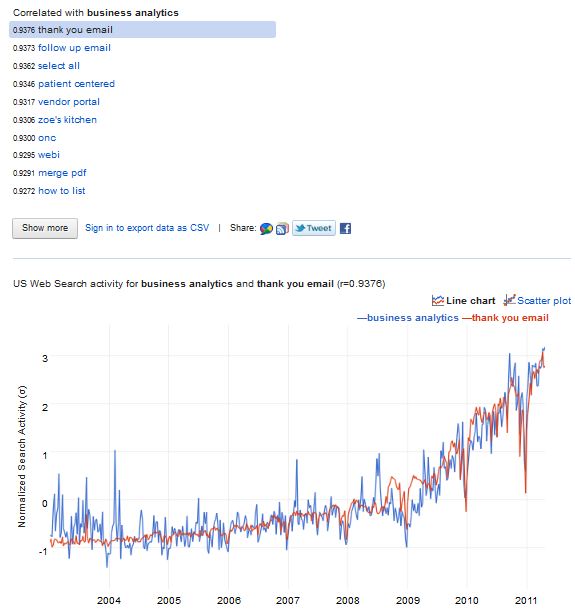
We can try another term with some currency:  “business analytics”.  The result is somewhat surprising.  “Thank you email”?  “Vendor portal”?  “Zoes Kitchen”?  It seems hard to make much sense of this.  As we know, “business analytics” is a relatively new term and the search quantity is less than that of “operations research” which perhaps explains the spurious correlations:  there are so many terms that are searched as often as “business analytics” that the highest correlations come more or less randomly.

To data people like us (me, anyway), the ability to search correlations is endlessly fascinating.  Shift the operations research time series by 13 weeks and what do you get:  things like “portable mp3” and “retriever pictures”:  clearly our students are bored with our course and are surfing around for something more entertaining.  What does “management science” search correlate with?  “introduction” and “social research”.  Is there anything interesting to be learned by the differences in correlates between operations research and management science?  Nothing springs to mind, but there might be a thesis or two there.

I am not sure what any of this means, but it sure is a great way to spend an early summer afternoon!


Business Analytics and Operations Research: Tomato, To-mah-toe, Tractor!

There are few things in life more tedious than assigning boundaries to fundamentally ill-defined concepts.  Either terms are used to divide things that cannot be divided (“No, no, that is reddish-purple and clearly not purplish-red!”) or are used to combine groups while ignoring any differences (Republicans?  Democrats?  just “Washington insiders”).  Arguing over the terms is fundamentally unsatisfying:  it rarely affects the underlying phenomena.

So when INFORMS (Institute of Operations Research and the Management Sciences), an organization of which I am proud to have been President and equally proud to be Fellow, embarks on its periodic nomenclature debate, ennui overwhelms.  Not again!  The initial debate between Operations Research and Management Science resulted in two societies (ORSA and TIMS) for forty years before they combined to form INFORMS in 1995.  Decision Engineering, Management Engineering, Operations Engineering, Management Decision Making, Information Engineering, and countless other terms have been proposed at times, and some have even made toeholds in the form of academic department names or other usages.  None of this has fundamentally changed our field, except perhaps in confusing possible collaborators and scaring off prospective members (“Wow, if they don’t even know who they are then maybe I should check out a more with-it field!”). I decided long ago to just stick with “operations research” and make faces of disgust whenever anyone wanted to engage the issue of the name of the field.
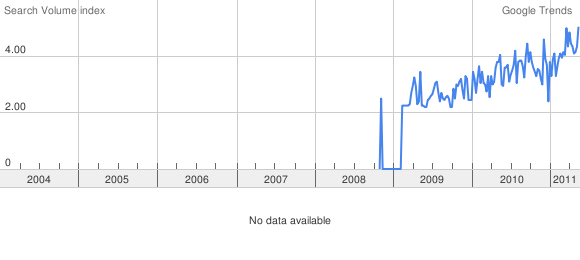
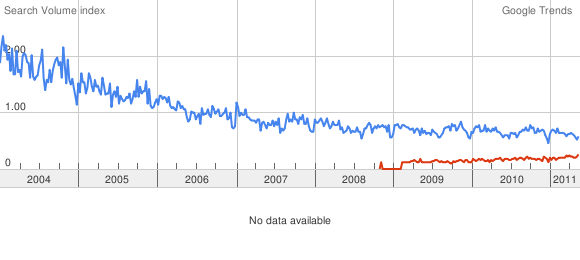
Then, three years ago (only! check the google trends graph) the phrase “business analytics” came along, and it was a miracle!  Here was the phrase that really described what we were doing:  using past data to predict the future and make better business decisions based on those predictions.  That’s us!  And, due to books such as “Competing on Analytics”, the wider world actually were interested in us!  There were even popular books like “The Numerati” about us.  We were finally popular!

Except it wasn’t really about “us” in operations research.  We are part of the business analytics story, but we are not the whole story, and I don’t think we are a particularly big part of the story.  A tremendous amount of what goes by the name “business analytics” are things like dashboards, business rules, text mining, predictive analytics,OLAP, and lots of other things that many “operations research” people don’t see as part of the field.  IBM’s Watson is a great analytics story, but it is not fundamentally an operations research story.  People in these areas of business analytics don’t see themselves as doing operations research.  Many of them don’t even identify with business analytics but rather with data mining, business intelligence, or other labels.   All of this involves “using past data to help predict the future to make better decisions” but “operations research” doesn’t own that aspect of the world.  There are lots of people out there who see this as their mandate but haven’t even heard of operations research, and really don’t care about that field.

This is not surprising for those with an INFORMS-centric point of view.  INFORMS does not (and near as I can tell, ever has) represent even all of “operations research”.  According to the Bureau of Labor Statistics, there are more than 65,000 people with the job “operations research analyst”.  INFORMS membership of a bit more than 10,000  is a small fraction of all those involved in operations research.  INFORMS is not all of operations research:  it certainly is a small amount of business analytics.  How can INFORMS “own” business analytics when it doesn’t even own operations research?

Recognizing this divide does not mean erecting a wall between the areas (see the first paragraph on the mendacity of labels).  I think the “business analytics” world has a tremendous amount to learn from the “operations research” world and vice versa.  Here are few things the two groups should know (and are clearly known by some on both sides, though not to an ideal extent);  I welcome your additions to these lists:

What Business Analytics People should Learn from Operations Research

  1. Getting data and “understanding” it is not enough.
  2. Predicting the future does not imply making better decisions.
  3. Lots of decisions are interlinked in complicated ways.  Simple rules are often not enough to reconcile those linkages.
  4. Handling risk is more than knowing about the risk or even modeling the risk.  See “stochastic optimization”.
  5. Organizations have been competing on and changed by analytics for a long, long time now.   See the Edelman competition to start.
  6. Operations research is not exactly an obscure field.  Check the google trends of “operations research” versus “business analytics” (with OR in blue and BA in red).
What Operations Research People should Learn from Business Analytics

  1. It is not just the volume of data that is important:  it is the velocity.  There is new data every day/hour/minute/second, making the traditional OR approach of “get data, model, implement” hopelessly old-fashioned.  Adapting in a sophisticated way to changing data is part of the implementation.
  2. Not everything is complicated.  Sometimes just getting great data and doing predictions followed by a simple decision model is enough to make better decisions.  Not everything requires an integer program, let alone a stochastic mixed integer nonlinear optimization.
  3. Models of data can involve more than means and variances, and even more than regression.
  4. One project that really changes a company is worth a dozen papers (or perhaps 100) in the professional literature.
  5. It is worthwhile for people to write about what is done in a way that real people can read it.

I believe strongly in both operations research and business analytics.  I have spent my career advancing “operations research” and have never shied from that name.  And I just led an effort to start an MBA-level track in business analytics track at the Tepper School.  This track includes operations research courses, but includes much more, including courses in data mining, probabilistic marketing models, information systems, and much more.

The lines between operations research and business analytics are undoubtedly blurred and further blurring is an admirable goal.  The more the two worlds understand each other, the more we can learn from each other.  INFORMS plays a tremendously important role in helping to blur the boundaries both by sharing the successes of the “operations research world” with the “business analytics” world, and by providing a conduit for information going the other way.  And this, more than “owning” business analytics, is what INFORMS and its members should be doing.

Ironically, this is part of the INFORMS Blog Challenge.


That’s got to be true… doesn’t it?

Back in 1996, Harvey Greenberg, longtime faculty member at the University of Colorado at Denver, began putting together a collection of myths and counterexamples in mathematical programming.  While generally I find mathematical programming to be quite intuitive, there turn out to be lots of things that I think must be true that are not.  Consider the following:

  1. The duality theorem applies to infinite LPs.
  2. Simulated annealing converges more slowly than steepest descent when there is a unique optimum.
  3. In linear programming, a degenerate basis implies there is a (weakly) redundant constraint.
  4. If f has continuous nth-order derivatives, local behavior of f can be approximated by Taylor’s series.
  5. The problem of finding integer x such that Ax = b, where A is an m by n integer matrix and b a length m integer vector, is NP-complete.

Amazingly none of these are true!  Reading through the myths and counterexamples reminds me of how much I “know” is really false.

The Myths and Counterexamples document is hosted by the INFORMS Computing Society as part of its Mathematical Programming Glossary, and Harvey periodically updates the Myths site (with the last update being in February 2010).  If you have shown that something that seems obvious is actually false, be sure to let Harvey know about it.  And the next time you are doing a proof and are tempted to make a claim because “it is well known that…” or “obviously…”, perhaps you should check out the site first.

Thanks to @fbahr and the folks at Reddit’s SYSOR for reminding me of the value of a project I have followed for about fifteen years so far!

Recently on OR-Exchange…

OR-Exchange is a question and answer site on operations research (and analytics).   The concept couldn’t be simpler.  People ask questions about operations research;  people answer questions about operations research.  Kinda like the usenet group sci.op-research without the spam.

I put together the site a couple of years ago when stack-exchange made it easy to put such sites on their server.  The idea was to mimic the popular mathoverflow site, but to specialize on operations research issues.  I had no idea of how well this would work, but it started off pretty active and continued to grow.

About a year ago, stackexchange decided on a different path, and they no longer wanted to host or support other groups.  Instead, groups of people could go through a process to become a true stackexchange site.  A number of groups have done that, and have done well with that path.  Unfortunately, our site was a little small for that direction.  Even now, with 381 “official users”, it would be the smallest of any stackexchange site (the current smallest is Jewish Life and Learning with 401 users).  The requirements to be a stackexchange site seemed insurmountable, so we needed another solution.

At this point, INFORMS stepped in and offered to sponsor the site.  After receiving confirmation that “sponsorship” did not mean “ownership” and that we could continue acting the way we were, we (i.e. me, along with a few of the very active participants) decided to move the site to INFORMS.  A big question was the software to use, since stackexchange software was no longer available.  Fortunately, there was an open source replacement from osqa.net, so it was just a matter of installing that….   Famous last words!  Installing the software and getting the current questions and answers from stackexchange was no easy feat.  Fortunately, David and Herman from INFORMS were up to the task, and were able to do the herculean task of getting things up and running smoothly.  The conversion happened on April 8, while I was sitting in a faculty meeting, doing the few minor things I needed to do, like pointing or-exchange.com from stackexchange to INFORMS (Here is some advice:when sitting in a faculty meeting, do not try to guess URLs;  godaddy and bigdaddy lead to radically different sorts of sites).  And things have worked great since then!

As I said, there are 381 registered users for the site, with about 40 being reasonably active.  But you don’t have to register to read the questions and answers, and there are about 300 unique visitors per day who do so, often due to hits at google.  This 300 is more than the background hits on this blog (when I post, hits spike up, but I run about 275 hits per day between posts).  There have been 316 questions asked, generating 1152 answers, along with at least that many comments.  At this point, there are eight moderators, though the moderation touch is extremely light.

Recently people have asked about

and much more!  It is a friendly group (except when it comes to answering homework problems!) so if you have a question in the area of operations research, broadly defined, don’t hesitate to check it out!  And thanks to INFORMS, and particularly Terry, David, and Herman, for the sponsorship and the outstanding technical support.

Maybe Analytics is not the Future for Operations Research

There is a lot of discussion on the role the word “analytics” should play in operations research. As a field, we have always had a bit of an identity issue. Perhaps “analytics” is the way we should go. Generally, I am supportive of this: I am part of a group that put together a “Business Analytics” track for my business school’s MBA program, and am delighted with how it resonates with both students and employers.

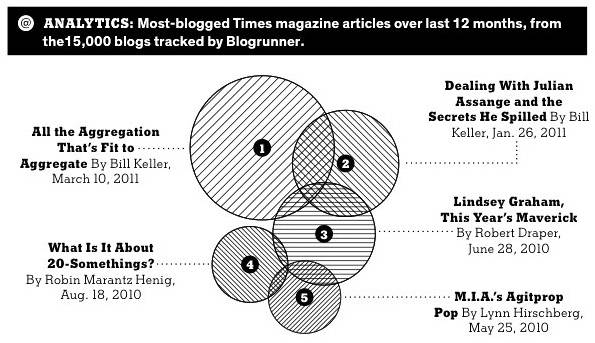
NY Times Most BloggedThen, there are times where I feel we should run away screaming. Today’s New York Times Magazine continues its “Analytics” graphics with a diagram on its most blogged articles. I include a local copy here, for I truly hope that a New York Times editor will feel sufficiently chagrined to remove it from the website and, ideally, from the memory of any who gazed at it.

First, the New York Times has decided to show this as a form of a Venn Diagram.  In this case, intersections should mean something.  What would they mean?  Since the underlying statistic is something like “blogs that mention the article”, presumably the intersection is blogs that mention both articles (or more if multiple circles intersect).  But is this even possible?  It appears that no blog mentions 4 articles (really?  there is no blog covering essentially all of what the New York Times is doing?), and the only 3 articles mentioned by 3 blogs are articles 1, 2, and 3 (unless maybe there is an intersection with 4, 5, and 6:  the diagram is not clear).  Is that even remotely possible?   There seem to be lots of blogs that mention 2 of the articles.   I can’t believe that there is no blog that covered both #1 (“aggregation”) and #4 (“20 year olds”), particularly since there were blogs that covered each along with #3 (“Lindsey Graham”).  The convenience of putting the circles from #1 down to #5 seems to have trumped any realistic representation of the intersections.

Second, this is supposed to be coverage of the last 12 months.  But #1 has been out about 6 weeks, while #5 has been out almost a year.  Is this raw data or is corrected for the different amount of time out?  There is certainly no clue from the graphic.

Third, while there is often controversy over the space needed to graphically display relatively little data, here is a great example where much of the data is not even shown!  The graphic says that it is based “from the 15,000 blogs tracked by Blogrunner”, but shows nothing about how often each article was blogged.  All we get are the relative values, not the absolutes.  And did they do the graph relative to radius or area?  You would hope area, but without the base data, there is no checking.

If this is what “Analytics” is, then operations research should have nothing to do with it.  And the New York Times Magazine editorial team had better think long and hard if they are qualified to put out “analytics” results in their otherwise admirable magazine.

Algorithmic Pricing

900,000,000 bookThe Twitterverse is giggling over some of the absurd pricing for some used books at Amazon (Panos Ipeirotis and Golan Levin were two  who tweeted on the subject).  There are books at Amazon where the price is in the millions of dollars!  How can such a thing happen?

While I love the picture of an eager seller (“I have just two books for sale, but, man, if I sell one, I am set for life!”), the explanation is much more mundane, at least in some cases. As the “it is NOT junk” blog shows, it is clear that two sellers of the book The Making of a Fly (a snip at a price height of a mere $23 million) are setting their price relative to each others price.  Seller A sets its price equal to .99830 times that of seller B;  B sets its equal to 1.27059 of A.  Every day the price of the book goes up by a factor of 1.26843.  Do this for a few months, and you’ll get prices in the millions.

This sort of market driven pricing is not unreasonable.  Sellers with good reputation are able to command higher prices (see, for instance, the paper by Ghosth, Ipeirotis, and Sundararajan on “Reputation Premiums in Electronic Peer-to-Peer Markets” for results and references). A firm might well feel that its reputation is worth a premium of 27.059%. Another firm might adopt an alternative strategy of just undercutting the competition by, say .0017%. Everything works fine until they become the only two firms in a market. Then the exponential growth in prices appears since there is no real “market” to base their differential on.

Such an issue would be nothing more than an amusing sideline if it weren’t for the effect such algorithmic prices can have on more important issues than obscure used books. The “flash crash” of the stock market in 2010 appears to have been caused by the interaction between one large sale and automated systems that executed trades based on trading volumes, not price. As the SEC report states:

“… under stressed market conditions, the automated execution of a large sell order can trigger extreme price movements, especially if the automated execution algorithm does not take prices into account. Moreover, the interaction between automated execution programs and algorithmic trading strategies can quickly erode liquidity and result in disorderly markets.”

Pricing based on markets abound.  At the recent Edelman competition, one of the groups (InterContinental Hotels Group) discussed a price-setting mechanism that had, as one of the inputs, the competing prices in the area. Fortunately, they had a “human in the loop” that prevents spiraling prices of the form seen at Amazon.

In a wish to be quick, there is great pressure to move to automated pricing. Until we create systems that are more robust to unforeseen situations, we risk having not just $900,000,000 books, but all sorts of “transient” effects when systems spin out of control.  And these effects can cause tremendous damage in a short period of time.