Using Analytics for Emergency Response

I just attended a great talk by Laura McLay at the German OR Society meeting in Aachen.  In her semi-plenary, Laura talked about all the work she has done in Emergency Medical Response.  Planning the location and operation of ambulances, fire trucks, emergency medical technicians, and so on is a difficult problem, and Laura has made very good progress in putting operations research to use in making systems work better.  She has been recognized for this work not only in our field (through things like outstanding paper awards and an NSF CAREER award) but also by those directly involved in emergency response planning, as evidenced by an award from the National Association of Counties.

Laura covered a lot of ground in her talk (she has a dozen papers or more in the area), but I found one result in particular very striking.  Many ambulance systems have a goal of responding to 80% of their calls in 9 minutes (or some such numbers).  One of the key drivers of those values is the survivability from heart attacks:  even minutes matter in such cases.response  
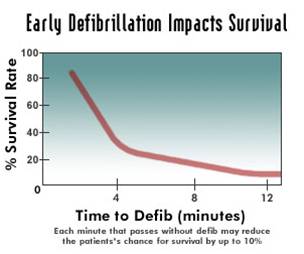
The graph attached (not from Laura, available in lots of places on the internet) shows a sharp dropoff as the minutes tick away.

But why 9 minutes?  It is clear from the data that if the goal is to provide response within 9 minutes, there is an awful lot of 8 minute 30 second response times.  Systems respond to what is measured.  Wouldn’t it be better, then to require 5 minute response times?  Clearly more people would be saved since more people would be reached within the critical first minutes.  This looks like a clear win for evidence-based medicine and the use of analytics in decision making.

But Laura and her coauthors have a deeper insight than that.  In the area they are looking at, which is a mix of suburban and rural areas, with a 9 minute response time, the optimal placement of ambulances is a mixture of suburban and rural locations.  With a 5 minute response time, it does no good to place an ambulance in a rural location: they can’t get to enough people in time.  All the ambulances would be placed in the higher-density suburban location.  If a call comes in from a rural location, eventually an ambulance would wend its way to the rural location, but after 20 or 30 minutes, many cases become moot.

To figure out the optimal response time, you need to figure out both survivability and the number of cases the system can reach.  For the area Laura and her team looked at, the optimal response time turned out to be 8 to 9 minutes.

Of course, this analysis is not relevant if the number of ambulances is increased with the decreased response time requirement.  But the enthusiasm for spending more on emergency response is not terrifically high, so it is more likely that the time will be changed without a corresponding increase in budget.  And that can have the effect of making the entire system worse (though things are better for the few the ambulance can reach in time).

This was a great example of the conflict between individual outcome and social outcomes in emergency response.  And a good example of how careful you need to be when using analytics in health care.

I highly recommend reading her Interfaces article “Hanover County Improves its Response to Emergency Medical 911 Patients” (no free version).  I even more highly recommend her blog Punk Rock Operations Research and her twitter stream at @lauramclay.

Taking Optimization With You After Graduation

In the Tepper MBA program, we use versions of Excel’s Solver (actually a souped up version from Frontline Systems)  for most of our basic optimization courses.  Students like this since they feel comfortable with the Excel interface and they know that they can use something like this in their summer internships and first jobs, albeit they are likely to the more crippled version standard with Excel.  For those who are particularly keen, we point them to an open source optimization system that can allow them to stay within the Excel structure.

In our most advanced course, we use AIMMS with Gurobi as the underlying solver. Students generally love the power of the system, but worry that they will not be able to translate what they learn into their jobs.  This wouldn’t be an issue if companies had analytics and optimization as a core strength, and routinely had some of the commercial software, but that is not the case.  So the issue of transfer comes up often.

I am really happy to see that Gurobi has a deal in place to allow students to continue using their software, even after they graduate.  This gives new graduates some time to wow their new employers with their skills, and to make the argument for further investment in operations research capabilities.

Here is an excerpt from an email I received from Gurobi:

Academic Site License

Our FREE academic site license allows students, faculty, and staff at a degree-granting academic institution to use Gurobi from any machine on a university local-area network. This program makes it easy for everyone at the university to have access to the latest version of Gurobi, without having to obtain their own license. You can learn more on our Academic Licensing page, and your network administrator can request a license by emailing support@gurobi.com.

Take Gurobi With You Program Update

This program allows qualified recent graduates to obtain a FREE one-year license of Gurobi for use at their new employer.

Qualified recent graduates can complete a short approval process and then receive the license including maintenance and support at no cost to themselves or their employers. This reflects our continuing support of students, even after they graduate. You can learn more on our Take Gurobi With You page.

I think this sort of program can have a great effect on the use of optimization in practice.  And we need to rethink what we teach in the classrooms now that we know the “can’t take it with you” effect is lessened.

The Baa-readth of Operations Research

IMG_20140806_150251At the recent International Federation of Operational Research Society (IFORS) meeting in Barcelona (a fabulous conference, by the way), I had the honor of being nominated as President of that “society of societies”.  If elected, my term will start January 1, 2016, so I get a bit of a head start in planning.

I was looking through one of the IFORS publications, International AbIMG_20140806_150201stracts in Operations Research.  I am sure I will write about this more, since I think this is a very nice publication looking for its purpose in the age of Google.  This journal publishes the abstracts of any paper in operations research, including papers published in non-OR journals.  In doing so, it can be more useful than Google, since there is no need to either limit keywords (“Sports AND Operations Research”) or sift through tons of irrelevant links.

I was scanning through the subject categories of the recent issue of IAOR to find papers published in “sports”.  I saw something really quite impressive.  Can you see what caught my eye?


Continue reading “The Baa-readth of Operations Research”

Optimization, Operations Research and the Edelman Prize

This year, I have the distinct honor of chairing the committee to award the Franz Edelman Award, given out by INFORMS for the best work that “attests to the contributions of operations research and analytics in both the profit and non-profit sectors”.  This competition has been incredibly inspiring to me throughout my career.  Just this year, as a judge, I got to see extremely high-quality presentations on eradicating polio throughout the world, bringing high-speed internet to all of Australia, facilitating long kidney exchange chains, and more.  I have seen dozens of presentations over my years as an Edelman enthusiast and judge, and I always leave with the same feeling: “Wow, I wish I had done that!”.

There is nothing that makes me more enthusiastic about the current state and future prospects of operations research than the Edelman awards.  And, as a judge, I get to see all the work that doesn’t even make the finals, much of which is similarly inspiring.  Operations Research is having a tremendous effect on the world, and the Edelman Prize papers are just the (very high quality) tip of the iceberg.

I was very pleased when the editors of Optima, the newsletter of the Optimization Society of INFORMS, the newsletter of the Mathematical Optimization Society, asked me to write about the relationship between optimization and the Edelman Prize.  The result is in their current issue.  In this issue, the editors published work by the 2013 winner of the Edelman, work on optimizing dike heights in the Netherlands, a fantastic piece of work that has saved the Netherlands billions in unneeded spending.  My article appears on page 6.  Here is one extract on why the Edelman is good for the world of optimization:

There are many reasons why those in optimization should be interested in, and should support, the Edelman award.

The first, and perhaps most important, is the visibility the Edelman competition gets within an organization. A traditional part of an Edelman presentation is a video of a company CEO extolling the benefits of the project. While, in many cases, the CEO has already known about the project, this provides a great opportunity to solidify his or her understanding of the role of optimization in the success of the company. With improved understanding comes willingness to further support optimization within the firm, which leads to more investment in the field, which is good for optimization. As a side note, I find it a personal treat to watch CEOs speak of optimization with enthusiasm: they may not truly understand what they mean when they say “lagrangian based constrained optimization” but they can make a very convincing case for it.

Despite the humorous tone, I do believe this is very important:  our field needs to be known at the highest levels, and the Edelman assures this happens, at least for the finalists.  And, as I make clear in the article: it is not just optimization.  This is all of operations research.

There are dozens of great OR projects done each year that end up submitted to the Edelman Award.  I suspect there are hundreds or thousands of equally great projects done each year that don’t choose to submit (it is only four pages!).  I am hoping for a bumper crop of them to show up in the submissions this year.  Due date is not until October, but putting together the first nomination would make a great summer project.

Blogging and the Changing World of Education

As a blogger, I have been a failure in the last six months.  I barely have enough time to tweet, let alone sit down for these extensively researched, tightly edited, and deeply insightful missives that characterize my blog.  I tell you, 1005 words on finding love through optimization doesn’t just happen!

phdtimeI have my excuses, of course.  As the fabulous PHD Comics points out, most of us academics seem somewhat overbooked, despite the freedom to set much of our schedule.  I am not alone in being congenitally unable to turn down “opportunities” when they come by.  “Help hire a Norwegian professor?” Sounds fun! “Be the external examiner for a French habilitation degree?” I am sure I’ll learn a lot!  “Referee another paper?” How long can that take?  “Fly to Australia for a few days to do a research center review?”  Count me in!  And that was just four weeks in February.

All this is in addition to my day job that includes a more-than-healthy dose of academic administration.  Between doing my part to run a top business school and to move along in research, not to mention family time, including picking up the leavings of a hundred pound Bernese Mountain Dog (the “Mountain” in the name comes from said leavings) and entertaining a truly remarkable nine-year-old son, my time is pretty well booked up.

And then something new comes along.  For me, this newness is something I had a hand in putting together: the Tepper School’s new FlexMBA program.  This program offers our flagship MBA program in a hybrid online/onsite structure.  Every seven weeks or so, students in the program gather at one of CMU’s campuses (we have them in Pittsburgh, Silicon Valley, and New York, we have not yet used our Qatar campus) and spend a couple days intensively starting their new courses.  This is followed by six weeks of mixed synchronous and asynchronous course material.  Asynchronous material is stuff the students can do in their own time: videos, readings, assignments, and so on.  The synchronous lesson is a bit more than an hour in a group, meeting via a group video conference, going over any issues in the material and working on case studies, sample problems, and so on.  The course ends with exams or other evaluations back on campus before starting the next courses.

Our commitment is to offer the same program as our full-time residential MBA and our part-time in-Pittsburgh MBA.  So this means, the same courses, faculty, learning objectives, and evaluations that our local students take.

We started this program last September with 29 students, and so far it has gone great.  The students are highly motivated, smart, hard-working, and engaged.  And the faculty have been amazing: they have put in tons of work to adapt their courses to this new structure.  Fortunately, we have some top-notch staff to keep things working.  Unlike some other MBA programs, we have not partnered with any outside firm on this.  If we are going to offer our degree, we want it to be our degree.

I have just finished my own course in this program.  I teach our “Statistical Decision Making” course.  This is a core course all MBA students take and revolves around multiple regression and simulation (the interesting relationships between these topics can wait for another day).  This is not the most natural course for me:  my research and background is more  on the optimization side, but I very much enjoy the course.  And teaching this course has made clear to me the real promise of the hot phrase “business analytics”:  the best of business analytics will combine the predictive analytics of statistics and machine learning with the prescriptive analytics of optimization, again a topic for another day.

My initial meeting with the students concentrated on an overview of the course and an introduction to the software through some inspiring cases.  We then moved on the the six-week distance phase.  Each of the six modules that make up a course is composed of four to eight topics.  For instance, one of my modules on multiple regression includes the topic “Identifying and Handling Muliticollinearity”.  (Briefly: multicollearity occurs when you do regression with two or more variables that can substitute for each other; imagine predicting height using both left-foot-length and right-foot-length as data).  That section of the module consists of

  • A reading from their textbook on the subject
  • One 8 minute video from me on “identifying multicollinearity”
  • One 6 minute video from me on “handling multicollinerity”
  • A three minute video of me using our statistical software to show how it occurs in the software (I separate this out so we can change software without redoing the entire course)
  • A question or two on the weekly assignment.

It would be better if I also had a quiz to check understanding of the topic, along with further pointers to additional readings.

So my course, which I previously thought of as 12 lectures, is now 35 or so topics, each with readings, videos, and software demonstrations.  While there are some relationships between the topics, much is independent, so it would be possible, for instance, to pull out the simulation portion and replace it with other topics if desired.  Or we can now repackage the material as some supplementary material for executive education courses.  The possibilities are endless.

Putting all this together was a blast, and I now understand the structure of the course, how things fit together, and how to improve the course.  For instance, there are topics that clearly don’t fit in this course, and would be better elsewhere in the curriculum.  We can simply move those topics to other courses.  And there are linkages between topics that I did not see before I broke down the course this finely.

I look forward to doing this for our more “operations research” type courses (as some of my colleagues have already done).  Operations Research seems an ideal topic for this sort of structure.  Due to its mathematical underpinnings and need for organized thinking, students sometimes find this subject difficult.  By forcing the faculty to think about it in digestible pieces, I think we will end up doing a better job of educating students.

Creating this course was tremendously time consuming.  I had not taken my own advise to get most of the course prepared before the start of the semester, so I was constantly struggling to stay ahead of the students.  But next year should go easier:  I can substitute out some of the videos, extend the current structure with some additional quizzes and the like, adapt to any new technologies we add to the program, and generally engage in the continuous improvement we want in all our courses.

But perhaps next year, I won’t have to take a hiatus from blogging to get my teaching done!


Russia really owned this podium

Back in 2010, Canada’s  goal was to “own the podium” at the Winter Olympics.  What “owning the podium” meant was open to interpretation.  Some argued for “most gold medals”; others opted for “most overall medals”; still others had point values for the different types of medals.  Some argued for normalizing by population (which was won, for London 2012, by Grenada with one medal and a population of 110,821, trailed by Jamaica, Trididad and Tobago, New Zealand, Bahamas, and Slovenia) (*). Others think the whole issue is silly: people win medals, not countries.  But still, each Olympics, the question remains: Who won the podium?

I suggested dividing the podium by the fraction of “reasonable” medal weightings that lead to a win by each country.  A “reasonable” weighting is one that treats gold at least as valuable as silver; silver at least as valuable as gold; no medal as a negative weight; and with total weighting of 1.  By that measure, in Vancouver 2010, the US won with 54.75% of the podium compared to Canada’s 45.25%.  In London 2012, the US owned the entire podium.

The Sochi Olympics have just finished and the result is…. Russia in a rout.  Here are the medal standings:


2014medals

Since Russia has more Gold medals than anyone else plus more “Gold+Silver” plus more overall, there are no reasonable weightings for gold, silver, and bronze that result in anyone but the Russian Federation from winning.

Nonetheless, I think Canada will take golds in Mens and Womens hockey along with Mens and Womens curling (among others) and declare this a successful Olympics.

———————————————————————————

(*)  I note that some sports limit the number of entries by each country, giving a disadvantage to larger countries for population based rankings (there is only one US hockey team, for instance but Lithuania also gets just one).

Own a Ton of Operations Research History

dantzigOr perhaps own two tons of Operations Research History (I am not sure how much 70 bankers boxes weigh)!  And not just any history:  this is the mathematics library of George B. Dantzig, available by “private treaty” (i.e.: there is a price;  if you pay it, you get the whole library) from PBA Galleries.  I suspect everyone who reads this blog knows who Dantzig was, but just in case: he is the Father of Operations Research.  His fundamental work on the simplex algorithm for linear programming and other work should have won the Economics Nobel Prize. He had a very long (spanning the 1940s practically to the end of his life in 2005) , and very influential, career.  You can read more about him in this article by Cottle, Johnson, and Wets.

At the auction site, there are also some reminiscences from his daughter Jessica Dantzig Klass.   She talks about some of the books in the library:

I found two copies of Beitraege zur Theorie der linearen Ungleichungen, Theodore S. Motzkin’s dissertation, translated “Contributions to the Theory of Linear Inequalities.” This work anticipated the development of linear programming by fourteen years and is probably the reason Motzkin is known as the “grandfather of linear programming”. A close family friend, Ted, as he was known, was a gentle, mild mannered man, with intense eyes, and a sweet smile, and he “lived” mathematics, even keeping small pieces of paper by his bed, so that when he had an idea at night he would be able to write it down. His dissertation is interesting from an historic perspective; bridging the gap between Fourier and my father’s work. Ted, a student at the University of Basel in Switzerland, was awarded his Ph.D. in 1933, but it was not published until 1936 in Jerusalem. One can trace the mathematical lineage of Motzkin’s advisor, Alexander Ostrowski, back to Gauss. And until his untimely death in 1970, Motzkin was my husband’s Ph.D. advisor at UCLA.

I don’t know how expensive the collection is (and I certainly don’t have room for 70 bankers boxes of material), but it would be great if an organization (INFORMS, are you listening) or a historically-minding researcher picked this up.  I suspect in the future, there will be far fewer libraries from great researchers.  I know that my own “library” is really nothing more than the hard drive on whatever computer I am using.

Scheduling Major League Baseball

ESPN has a new “30 for 30” short video on the scheduling of Major League Baseball.  In the video, they outline the story of Henry and Holly Stephenson who provided Major League Baseball with its schedule for twenty-five years.  They were eventually supplanted by some people with a computer program.  Those people are Doug Bureman, George Nemhauser, Kelly Easton, and me, doing business as “Sports Scheduling Group”.

It was fascinating to hear the story of the Stephensons, and a little heart-breaking to hear them finally losing a job they obviously loved.  I have never met Henry or Holly, and they have no reason to think good thoughts about me.  But I think an awful lot of them.

I began working on baseball scheduling in 1994, and it took ten years of hard work (first Doug and me, then the four of us) before MLB selected our schedule for play.

Why were we successful in 2004 and not in 1994? At the core, technology changed. The computers we used in 2004 were 1000 times faster than the 1994 computers. And the underlying optimization software was at least 1000 times faster. So technology made us at least one million times faster. And that made all the difference. Since then, computers and algorithms have made us 1000 times faster still.  And, in addition, we learned quite a bit about how to best do complicated sports scheduling problems.

Another way to see this is that in 1994, despite my doctorate and my experience and my techniques, I was 1 millionth of the scheduler that the Stephensons were. Henry and Holly Stephenson are truly scheduling savants, able to see patterns that no other human can see. But eventually technological advances overtook them.

More recently, those advances allowed us to provide the 2013 schedule with interleague play in every time slot (due to the odd number of teams in each league), something not attempted before. I am confident that we are now uniquely placed to provide such intricate schedules. But that does not take away from my admiration of the Stephensons: I am in awe of what they could do.


In Praise of Poster Sessions

At the recent INFORMS (Institute for Operations Research and the Management Sciences) conference, I was a judge for one of the days for the poster session (or “Interactive Session”, as INFORMS prefers).  As a judge, I first spent five minutes each with three participants.  After making recommendations for finalists, the entire judging panel (a dozen or so people) then spent five minutes each with five finalists.  We then crowned a third place, second place, and first place winner.

A week after the conference, I can describe in detail what each of those eight researchers (all students, I believe) did.  I can give you the strengths and weaknesses of the research of the eight posters, and can use them as examples of work that goes on in our field.  If I were hiring, I know at least two or three people I would love to have at the Tepper School.   All this with forty minutes of engagement.

Contrast this with the presentations I saw in the “regular” sessions.  I attended four sessions (not including my own, nor tutorials or plenaries).  Each was ninety minutes long, so that makes six hours.  During that time, I saw about 14 presentations.  I remember about half of them.  I didn’t really get a chance to ask questions, and I tuned out of some once I really understood what they were going to inflict on me.  Again, there were at least two or three people I would love to have at the Tepper School, some of whom are already here (and I didn’t tune out of those!), but, overall, the talks I saw did not turn out to be as memorable as the interactive presentations.

Worse, consider the plight of a student I know.  He was to give a talk in a “regular” session.  There were two people in the room other than the speakers.  Two speakers did not show.  The other talks were on nothing at all similar to what the student had done, so everyone in the room spent his talk reading the bulletin wondering where they would rather be.  No questions, no interaction.

Or another student who ended up with just ten minutes to present because the session chair allowed the other, more senior, people to run over.  Or another student I saw who had a delightful talk curtailed by technological and other issues.  A PhD comic seems particularly appropriate here:

PhD Comics take on Conference presentations

So, I guess my question is: “Why don’t we have more poster interactive sessions?”  Or even all poster sessions, except for the tutorials and plenary presentations.  It is good for the presenter and good for the participants!

Note added:  This also reminds me of having a five minute video as an adjunct to a paper, as this one sent to me by Les Servi.  It is a great way to determine if a paper is worth further study.