Touring the Rio Olympics

I’m a sportswriter who is bound for the Olympics, and I’m writing an article about maximizing the number of events I see in a particular day.

I thought the input of a mathematician with expertise in these matters would be helpful to the story.

This was an interesting start to day a month ago.  I received this email from New York Times reporter Victor Mather via University of Waterloo prof Bill Cook.  Victor had contacted Bill since Bill is the world’s foremost expert on the Traveling Salesman Problem (he has a must-read book aimed at the general public called In Pursuit of the Traveling Salesman: Mathematics at the Limits of Computation).  The TSP involves visiting a number of sites while traveling the minimum distance.  While Victor’s task will have some aspects of the TSP,  there are scheduling aspects that I work on so Bill recommended me (thanks Bill!).

Victor’s plan was to visit as many Olympic events in Rio as he could in a single day.  This was part of a competition with another reporter, Sarah Lyall.  Victor decided to optimize his day; Sarah would simply go where her heart took her.  Who would see more events?

Victor initially just wanted to talk about how optimization would work (or at least he made it seem so) but I knew from the first moment that I would be optimizing his day if he would let me.  He let me.  He agreed to get me data, and I would formulate and run a model that would find his best schedule.

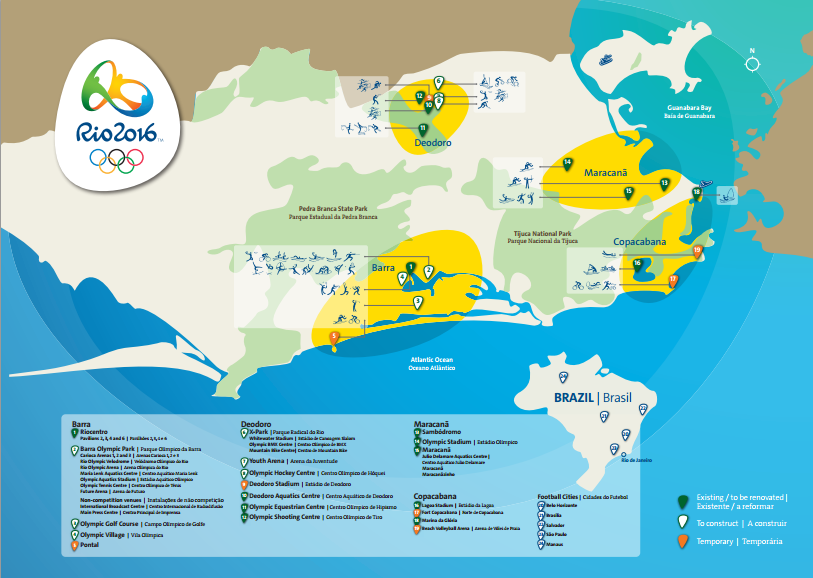
On the day they chose (Monday, August 15), there were 20 events being held.  rio-2016The map shows that the venues are all spread out across Rio (a dense, somewhat chaotic, city not known for its transportation infrastructure).  So we would have to worry about travel distance.  Victor provided an initial distance matrix, with times in minutes (OLY times).  As we will see, this matrix must have been created by someone who had a few too many caipirinhas on Copacabana Beach:  it did not exactly match reality.
So far the problem does look like a TSP: just minimize the distance to see 20 sites.  The TSP on 20 sites is pretty trivial (see a previous blog post for how hard solving TSPs are in practice) so simply seeing the sites would be quite straightforward.  However, not surprisingly Victor actually wanted to see the events happening.  For that, we needed a schedule of the events, which Victor promptly provided:

Badminton 8:30 am – 10:30 am // 5:30 pm -7
Basketball 2:15 pm – 4:15 pm// 7 pm -9 pm // 10:30 pm – midnite
Beach Volleyball 4 p.m.-6 p.m. // 11pm – 1 am
Boxing 11 am-1:30 pm, 5 pm – 7:30 pm
Canoeing 9 am – 10:30 am
Cycling: 10 a.m. – 11 am /// 4 pm – 5:30
Diving 3:15 pm -4:30
Equestrian 10 am- 11 am
Field Hockey 10 am – 11:30 am // 12:30 –2 // 6-7:30 pm // 8:30 pm -10
Gymnastics 2 pm -3 pm
Handball: 9:30 am- 11 am// 11:30 – 1pm //2:40 -4 //4:40 – 6 pm // 7:50 – 9:10 pm // 9:50 pm -11:10
Open water Swimming 9 am – 10 am
Sailing 1 pm – 2 pm
Synchronized swimming: 11 am- 12:30
Table tennis 10 am -11 am // 3pm -4:30 // 7:30pm – 9
Track 9:30 am -11:30 am // 8:15pm -10 pm
Volleyball 9:30 am- 10:30 am // 11:30 – 12:30 // 3pm – 4 pm // 5 pm – 6 pm // 8:30 pm -9:30 // 1030 pm -11:30
Water polo 2:10 pm – 3 pm // 3:30 -4:20 //6:20 -7:10 // 7:40 – 8:30
Weightlifting 3:30 – 4:30 pm // 7 pm- 8 pm
Wrestling 10 am – noon // 4 pm- 6 pm

Many events have multiple sessions:  Victor only had to see one session at each event, and decided that staying for 15 minutes was enough to declare that he had “seen” the event.  It is these “time windows” that make the problem hard(er).

With the data, I promptly sat down and modeled the problem as an mixed-integer program.  I had variables for the order in which the events were seen, the time of arrival at each event, and the session seen for each event (the first, second, third or so on).  There were constraints to force the result to be a path through the sites (we didn’t worry about where Victor started or ended: travel to and from his hotel was not a concern) and constraints to ensure that when he showed up at an event, there was sufficient time for him to see the event before moving on.

The objective was primarily to see as many events as possible.   With this data, it is possible to see all 20 events.  At this point, if you would like to see the value of optimization, you might give it a try:  can you see all 20 events just by looking at the data?  I can’t!

But there may be many ways to see all the events.  So, secondarily, I had the optimization system minimize the distance traveled.  The hope was that spending less time on the buses between events would result in a more robust schedule.

I put my model in the amazing modeling system AIMMS.  AIMMS lets me input data, variables, constraints, and objectives incredibly quickly and intuitively, so I was able to get a working system together in a couple of hours (most of which was just mucking about with the data).  AIMMS then generates the integer program which is sent to Gurobi software (very fast effective mixed-integer programming solution software) and an hour later I had a schedule.

start Arrival Next travel time
canoe 9:00 20
open swimming 9:35 45
equestrian 10:35 35
wrestling 11:25 10
synchro 12:15 30
sailing 13:00 30
gymnastics 14:00 10
handball 14:40 10
basketball 15:05 10
diving 15:30 10
cycling 17:00 30
beach volleyball 17:45 30
badminton 18:40 5
boxing 19:00 5
weightlifting 19:20 5
table tennis 19:40 10
water polo 20:05 35
hockey 20:55 35
track 21:45 20
volley 22:30
end 22:45

This schedule has 385 minutes on the bus.

I discussed this problem with my colleague Willem van Hoeve, who spent about five minutes implementing a constraint programming model (also in AIMMS) to confirm this schedule.  He had a access to a newer version of the software, which could find and prove optimality within minutes.  Unfortunately my version of the software could not prove optimality overnight, so I kept with my MIP model through the rest of the process (while feeling I was driving a Model T, while a F1 racecar was sitting just up the hallway).  CP looks to be the right way to go about this problem.

I spent some time playing around with these models to see whether I could get something that would provide Victor with more flexibility.  For instance, could he stay for 20 minutes at each venue?  No: the schedule is too tight for that.  So that was the planned schedule.

But then Victor got to Rio and realized that the planned transportation times were ludicrously off.  There was no way he could make some of those trips in the time planned.  So he provided another transportation time matrix (olympics3) with longer times.  Unfortunately, with the new times, he could not plan for all 20: the best solution only allows for seeing 19 events.

Event Arrival Next Travel Slack
canoe 9:00 30
track 9:45 45
equestrian 10:45 35
synchro 11:35 60 0:10
sailing 13:00 60
gymnastics 14:15 15
water polo 14:45 15
diving 15:15 15 0:25
cycling 16:10 15
handball 16:40 15
wrestling 17:10 25
boxing 17:50 15
badminton 18:20 15 0:10
weightlifting 19:00 15 0:35
table tennis 20:05 25
basketball 20:45 35 0:10
hockey 21:45 45 0:30
volley 23:15 30
beach volleyball 0:00

So that is the schedule Vincent started with.  I certainly had some worries.  Foremost was the travel uncertainty.  Trying to minimize time on the bus is a good start, but we did not handle uncertainty as deeply as we could have.  But more handling of uncertainty would have led to a more complicated set of rules and it seemed that a single schedule would be more in keeping with the challenge.  The morning in particularly looked risky, so I suggested that Victor be certain to get to gymnastics no later than 2:15 in order to take advantage of the long stretch of close events that follow.  Sailing in particular, looked to be pretty risky to try to get to.

I had other worries:  for instance, what if Victor arrived during half-time of an event, or between two games in a single session?  Victor probably wouldn’t count that as seeing the event, but I did not have the detailed data (nor an idea of the accuracy of such data if it did exist), so we had to hope for the best.  I did suggest to Victor that he try to keep to the ordering, leaving an event as soon as 15 minutes are up, hoping to get a bit more slack when travel times worked out better than planned (as-if!).

So what happened?  Victor’s full story is here and it makes great reading (my school’s PR guy says Victor is “both a reporter and a writer”, which is high praise).  Suffice it to say, things didn’t go according to plan. The article starts out:

There are 20 [events] on the schedule on Monday.  Might an intrepid reporter get to all of them in one day?  I decide to find out, although it doesn’t take long to discover just how difficult that will be.

The realization comes while I am stranded at a bus stop in Copacabana, two and a half hours into my journey.  The next bus isn’t scheduled for three hours.  And I’ve managed to get to exactly one event, which I could barely see.

I had given him some rather useless advice in this situation:

“Something goes wrong, you reoptimize,” Professor Trick had cheerfully said.  This is hard to do sitting on a bus with the computing power of a pen and a pad at my disposal.

Fortunately, he got back in time for the magical sequence of events in the afternoon and early evening.  One of my worries did happen, but Victor agilely handled the situation:

Professor Trick urged me in his instructions to “keep the order!”  So it is with some trepidation that I go off-program.  Wrestling is closer to where I am than handball, and it looks like I will land at the handball arena between games.  So I switch them.  It’s the ultimate battle of man and machine — and it pays off.  I hope the professor approves of my use of this seat-of-the-pants exchange heuristic.

I do approve, and I very much like the accurate use of the phrase “exchange heuristic”.

At the end Victor sees 14 events.  19 was probably impossible, but a few more might have been seen with better data.  I wish I had used the optimization code to give Victor some more “what-ifs”, and perhaps some better visualizations so his “pen and pad optimization” might have worked out better.  But I am amazed he was able to see this many in one day!

And what happened to Sarah, the reporter who would just go as she pleased?  Check out her report, where she saw five events.  If Victor went a little extreme getting a university professor to plan his day, Sarah went a little extreme the other way in not even looking at a map or a schedule.

This was a lot of fun, and I am extremely grateful to Victor for letting me do this with him (and to Bill for recommending me, and to Willem for providing the CP model that gave me confidence in what I was doing).

I’ll be ready for Tokyo 2020!
Blogging and the Changing World of Education

As a blogger, I have been a failure in the last six months.  I barely have enough time to tweet, let alone sit down for these extensively researched, tightly edited, and deeply insightful missives that characterize my blog.  I tell you, 1005 words on finding love through optimization doesn’t just happen!

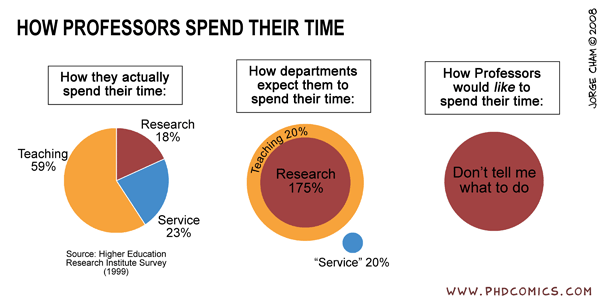
phdtimeI have my excuses, of course.  As the fabulous PHD Comics points out, most of us academics seem somewhat overbooked, despite the freedom to set much of our schedule.  I am not alone in being congenitally unable to turn down “opportunities” when they come by.  “Help hire a Norwegian professor?” Sounds fun! “Be the external examiner for a French habilitation degree?” I am sure I’ll learn a lot!  “Referee another paper?” How long can that take?  “Fly to Australia for a few days to do a research center review?”  Count me in!  And that was just four weeks in February.

All this is in addition to my day job that includes a more-than-healthy dose of academic administration.  Between doing my part to run a top business school and to move along in research, not to mention family time, including picking up the leavings of a hundred pound Bernese Mountain Dog (the “Mountain” in the name comes from said leavings) and entertaining a truly remarkable nine-year-old son, my time is pretty well booked up.

And then something new comes along.  For me, this newness is something I had a hand in putting together: the Tepper School’s new FlexMBA program.  This program offers our flagship MBA program in a hybrid online/onsite structure.  Every seven weeks or so, students in the program gather at one of CMU’s campuses (we have them in Pittsburgh, Silicon Valley, and New York, we have not yet used our Qatar campus) and spend a couple days intensively starting their new courses.  This is followed by six weeks of mixed synchronous and asynchronous course material.  Asynchronous material is stuff the students can do in their own time: videos, readings, assignments, and so on.  The synchronous lesson is a bit more than an hour in a group, meeting via a group video conference, going over any issues in the material and working on case studies, sample problems, and so on.  The course ends with exams or other evaluations back on campus before starting the next courses.

Our commitment is to offer the same program as our full-time residential MBA and our part-time in-Pittsburgh MBA.  So this means, the same courses, faculty, learning objectives, and evaluations that our local students take.

We started this program last September with 29 students, and so far it has gone great.  The students are highly motivated, smart, hard-working, and engaged.  And the faculty have been amazing: they have put in tons of work to adapt their courses to this new structure.  Fortunately, we have some top-notch staff to keep things working.  Unlike some other MBA programs, we have not partnered with any outside firm on this.  If we are going to offer our degree, we want it to be our degree.

I have just finished my own course in this program.  I teach our “Statistical Decision Making” course.  This is a core course all MBA students take and revolves around multiple regression and simulation (the interesting relationships between these topics can wait for another day).  This is not the most natural course for me:  my research and background is more  on the optimization side, but I very much enjoy the course.  And teaching this course has made clear to me the real promise of the hot phrase “business analytics”:  the best of business analytics will combine the predictive analytics of statistics and machine learning with the prescriptive analytics of optimization, again a topic for another day.

My initial meeting with the students concentrated on an overview of the course and an introduction to the software through some inspiring cases.  We then moved on the the six-week distance phase.  Each of the six modules that make up a course is composed of four to eight topics.  For instance, one of my modules on multiple regression includes the topic “Identifying and Handling Muliticollinearity”.  (Briefly: multicollearity occurs when you do regression with two or more variables that can substitute for each other; imagine predicting height using both left-foot-length and right-foot-length as data).  That section of the module consists of

  • A reading from their textbook on the subject
  • One 8 minute video from me on “identifying multicollinearity”
  • One 6 minute video from me on “handling multicollinerity”
  • A three minute video of me using our statistical software to show how it occurs in the software (I separate this out so we can change software without redoing the entire course)
  • A question or two on the weekly assignment.

It would be better if I also had a quiz to check understanding of the topic, along with further pointers to additional readings.

So my course, which I previously thought of as 12 lectures, is now 35 or so topics, each with readings, videos, and software demonstrations.  While there are some relationships between the topics, much is independent, so it would be possible, for instance, to pull out the simulation portion and replace it with other topics if desired.  Or we can now repackage the material as some supplementary material for executive education courses.  The possibilities are endless.

Putting all this together was a blast, and I now understand the structure of the course, how things fit together, and how to improve the course.  For instance, there are topics that clearly don’t fit in this course, and would be better elsewhere in the curriculum.  We can simply move those topics to other courses.  And there are linkages between topics that I did not see before I broke down the course this finely.

I look forward to doing this for our more “operations research” type courses (as some of my colleagues have already done).  Operations Research seems an ideal topic for this sort of structure.  Due to its mathematical underpinnings and need for organized thinking, students sometimes find this subject difficult.  By forcing the faculty to think about it in digestible pieces, I think we will end up doing a better job of educating students.

Creating this course was tremendously time consuming.  I had not taken my own advise to get most of the course prepared before the start of the semester, so I was constantly struggling to stay ahead of the students.  But next year should go easier:  I can substitute out some of the videos, extend the current structure with some additional quizzes and the like, adapt to any new technologies we add to the program, and generally engage in the continuous improvement we want in all our courses.

But perhaps next year, I won’t have to take a hiatus from blogging to get my teaching done!


Operations Research and Business Schools: The Good!

Way back in 1988, I was a fresh Ph.D. out of Georgia Tech doing a postdoc at the Institute for Mathematics and its Applications at the University of Minnesota.  While I had plans to spend another postdoc year, likely in Europe (and I ended up doing so, in Germany), I did decide it would be good to lock up an academic job before I left.   Email did exist at the time, but the norm was to send things out via “regular” mail.  So I went down to the copy center at the University and picked out a suitably heavy-weight paper for my vita.  I sent out a dozen or so responses to job ads and made a few phone calls (or asked my advisor to make a few calls) and was invited to visit a half-dozen or so places.  Perhaps it was  different era, or perhaps I was relaxed knowing that I had another year of postdoc funds if needed, but it certainly felt more relaxed that it appears to be these days.

One place that seemed eager to have me out was this “business school” at Carnegie Mellon:  The Graduate School of Industrial Administration.  Now, I came out of engineering and I certainly believed that my future lie in engineering.  Here is a sign of how little those of us in engineering knew about business schools:  the previous year, a fellow doctoral student went out on the market and interviewed at a number of places before finding a job at a business school.  At the time, we were all a bit surprised since he had a good dissertation and we (other doctoral students) thought that it was good enough to get a top engineering job.  Too bad he was stuck in a business school, we said:  must be a tough job market.  That school was the University of Chicago, then and now a preeminent business school that much of the field would kill to get a job at. Business schools were really not on our radar.

But I was polite, so I agreed to head out to Carnegie Mellon.  It was my first job interview, so I told myself the school would be a great place to practice my talk before moving on to the real contenders.

I hadn’t planned on liking CMU and GSIA as much as I did.  The people I talked to were much different than those at engineering schools.  Of course, there were some top-notch OR people (more on them later) but I also talked to economists and political scientists and even a psychologist or two.  They were involved in fascinating research that was a little less … transactional than much of engineering research (“Do this since the grant depends on it”).  And the Deputy Dean of the time, Tim McGuire (now at Management Science Associates) was very persuasive about how exciting things can be in business schools.

But even more persuasive was Egon Balas, an intellectual leader in the operations research since the 1960s.  While I did (and do) find him a bit intimidating, Egon had (and has) a tremendous love for integer programming, and amazing energy in research. He also had spend decades keeping up the tradition GSIA had of having a great OR group.  Founders such as Herb Simon, Bill Cooper, Al Blumstein, and Gerry Thompson had been (or in Gerry’s case, still were) part of GSIA, and the OR group was, in 1988, pretty amazing: Gerard Cornuejols and John Hooker joined Gerry and Egon to form the group.

I received an offer from GSIA and from some top engineering schools, and, to my surprise, I decided that my future lay in the business school.  And that is not a decision I have regretted.  GSIA (now Tepper) continues to have a top-notch OR group.  Gerry retired, then passed away, but we added R. Ravi, Javier Pena, Francois Margot, Willem van Hoeve, and Fatma Kilinc-Karzan.  Gerard Cornuejols continues to do amazing work, having recently won the von Neumann Theory Prize.

With the larger faculty size comes a stable and important role within the business school.  Operations research is seem as a key competitive advantage to our school.  While there are many aspects of this advantage, I’ll point to two:  the increased role of business analytics, and the role rankings play in business school success.  If you don’t believe me on the latter, I’ll point you to the list of journals Business Week uses for their intellectual capital ranking.  If you have people who can publish in Operations Research, you can be a more successful business school.  I recently heard my Dean, a hard-core finance researcher, say “We need more OR faculty”:  music to my ears!

And, the best part is, Egon Balas is still with us and still active.  He turns 90 this week, so we had a tea for him (we had a big conference when he turned 80;  we can do that again for his 100th).  A bunch of us did short video clips to wish Egon happy birthday.  Here is mine:

As you might guess, I am proud to be part of the operations research group here at the Tepper School. The school has been very good for operations research … and operations research has been very good for the school.

Sports with a vague Operations Research connection

It is pretty clear that academic administration and blogging are perfect substitutes, at least in regard to time, if not satisfaction.  After having an easy period earlier in the year when I racked up a dozen blog posts, administrative needs sucked up all my time, leading to the buildup of dust-bunnies at Ye Olde Blog.  But it is the end of term, so perhaps I can get things cleaned out.

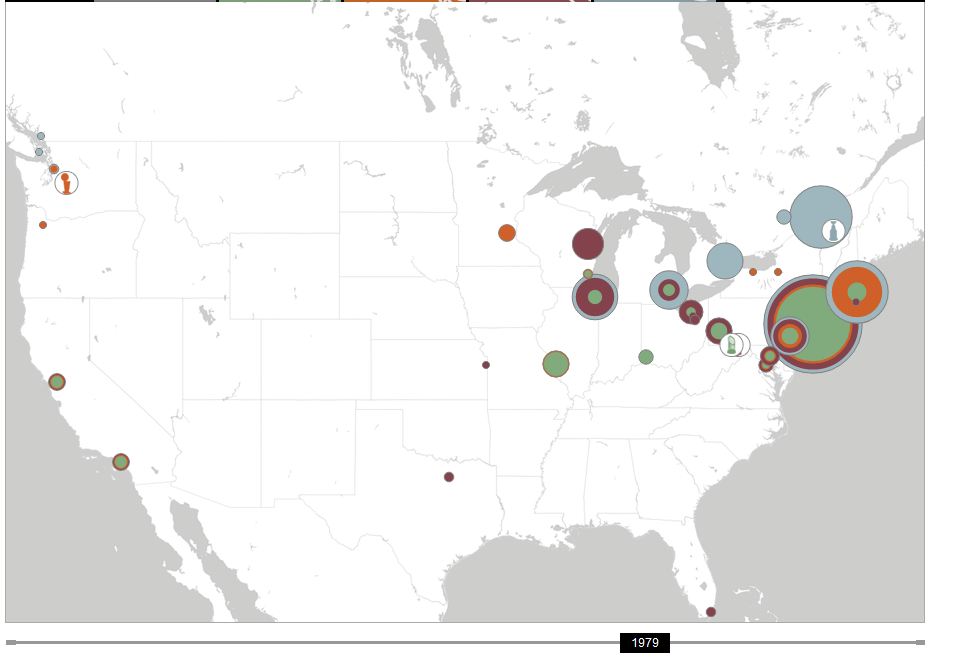
Let me point out two recent sports-oriented items.  First is a fascinating dynamic map from Slate showing the winning of sports championships in the four major US sports (football, baseball, hockey, and basketball).  The progression is fascinating, and the graphical display gives far more information than the static listing does.  It is a great example of the value of visualization, even if I can’t quite figure out what the value is.  The graphic to the left shows a particularly good year:  1979 when Pittsburgh really was “The City of Champions”.

Second, there were two good articles on sports scheduling.  The first was on NFL scheduling in the New York Times.  Lots of people sent me this, since I’m part of the group that does Major League Baseball Scheduling.  The article does a great job of talking about all difficulties there are in agreeing on a schedule. Ironically, some of these difficulties come from the ease at which it is possible to get NFL schedules.  When it is possible to ask “What if we had Pittsburgh play New England in week 3?” and get back appropriate schedules quickly, it is tempting to ask a near-endless set of questions.  Particularly when there are many interested parties and no particular rules for aggregating preferences.

Baseball scheduling doesn’t provide the same quick response.  Due partially to the size of the schedule (2430 games or 780 series rather than the NFL’s 256 games) but due mainly to the scheduling difficulty of “good trips” (an issue of minimal importance to the NFL since teams return home after almost every game), the turn-around time on MLB schedules is measured in days or weeks, not minutes or hours.  Which brings me to the second article:  an article in the LA Times on baseball scheduling.  It even quotes my partner Doug Bureman:

Bureman, whose company also does the scheduling for several major-college conferences, summed up the job this way:

“We’re kind of in the business of seeking perfection, knowing that you’re never going to get there.”

That is for sure:  we are a long way from perfection!  But this year has been fascinating due to realignment issues:

All of this gets even more jumbled in 2013 when MLB realigns, with the Houston Astros moving to the American League and both leagues having 15 teams. (Currently there are 16 in the NL, 14 in the AL.) Interleague games will then be spread through the season instead of being bunched together around midseason as they are now.

Feeney and her group are currently working on that 2013 schedule, and have found it to be quite a challenge. “We’re still struggling with the format,” she said.

For a sports scheduler, this “struggle” is a once-in-a-lifetime opportunity, and it has been tremendously fun and interesting to work out how that format might work.

In between bouts of academic administration!


Summer Time Travel Plans

As I sit in a jet-lagged haze in a Beijing hotel,thoughts naturally turn to …. more travel!  The opportunity to travel all around the world is a great bonus of academia.   And while I think I have taken this bonus to extremes (I am not sure academics should really be at the highest tiers of frequent fliers), it is nice to visit new places, see new sights, and meet new people.

In operations research, we have a tremendous number of conferences all around the world.  It is clear from things like the INFORMS Conference Calendar that a suitably enthusiastic, and financed, researcher could simply spend his or her life bopping around to conferences.  For me, this is limited by a couple of things:  first, I have an administrative role now, and if I am not around then …. well, I’m not sure what happens, but I feel I should be around.  Second, my family already asks for my business card when I return to remind them of who I am.  I do not want to make this even worse.

But I do have a few trips planned:

  • INFORMS Business Analytics and Operations Research (April 14-16).  A great conference, worth the higher-than-average cost.  I’m a judge at the Edelman’s again which has the plus side that I get to watch the Edelman presentations from a front-row seat, and I have read the papers beforehand.  On the downside, I don’t get to attend many of the other presentations.  I always come back with a class or two of material for my courses.
  • EURO 2012 (July 8-11).  I like the EURO conferences:  they are like INFORMS conferences, though somewhat smaller.  This year’s conference is in Vilnius, Lithuania, so I get to visit a new-to-me country.  Further, I am on the committee for the 2013 conference in Rome, so this conference is not really optional.  On the downside, getting to Vilnius is not the easiest!  I wish I had booked some flights when I first looked a month ago:  those flights are now full and the real power of revenue management is coming to bear on the other flights.  How much can airlines squeeze out of 2000 operations researchers?
  • MOPTA (July 30-August 1).  Held at Lehigh University, this conference has the advantage that I can drive to it (take that, revenue management maximizers!).  Held for a number of years at McMaster University in Canada, this conference has moved to Lehigh and brings together continuous, discrete, and stochastic optimizers in both theory and practice.  I’ll be talking about some of the optimization we use in sports scheduling.
  • Matheuristics (September 16-21) at a beach outside of Rio de Janeiro, Brazil.  It’s a beach, it’s Rio, it combines mathematical optimization with heuristics.  Need I say more?
I do have some other travel, including a quick hop to Australia to make sure people there are working hard pushing back the frontiers (I’m sure it is all optimization of kangaroo sustainability and the like, but we’ll see).

There are a lot more conferences that I would like to attend, both big and small.  INFORMS Beijing would be great to attend, but I was in Beijing in November and again right now (for academic administration reasons) so a third trip in 8 months would be too much.   PATAT (Practice and Theory of Automated Timetabling) is a series I like very much and is in Oslo, a city I like to visit, but it occurs this year at the start of term so I have to stay in Pittsburgh so that …. again, I’m not sure why I need to academically administrate at that time, but it appears I do.  CPAIOR (Constraint Programming, Artificial Intelligence, and Operations Research) is in Nantes, France this year (May 28 – June 1) but is not close enough in timing to the Vilnius EURO conference.  Similarly, it is hard not to attend the big International Symposium on Mathematical Programming Symposium in Berlin, but it too is too long after Vilnius and too close to the start of school.

And there are a few conferences in the fall that I am thinking about:  Constraint Programming is in Quebec City (a trés bon place to visit!) October 8-12.  Computational Social Choice is another interest of mine and will be held in Krakow, Poland September 11-13.    Chances are pretty good I’ll be at the main INFORMS Conference in Phoenix October 14-17   (hmmm… I wonder how the flights are from Quebec City to Phoenix):  I never miss the chance to get together with 4000 of my closest friends!

I think I’m going to need some optimization models to help choose conferences!


Operations Research Resolutions for 2012

It is the time of the year for resolutions.  Resolutions help define what we would like to be, but are damned hard things to follow through on.  As Paul Rubin points out, gyms will be overrun for a few weeks with “resolvers” (or, as my former personal trainer called them “resolutionists”) before the weight room empties again.  I’ve been as guilty as any in this regard:  it is no coincidence that my gym membership runs January 15-January 15 and that I renew it each year with the best intents, and the worst results.  Paul suggests an OR view of resolutions:

…the New Year’s resolution phenomenon offers a metaphor for O. R. practice. The “resolver” diets, exercises, stops smoking or whatever for a while because the “boss” (their conscience) is paying attention.  When the “boss” stops watching, the “resolver” makes excuses for why the new regime is too difficult, and reverts to previous behavior.  An O. R. solution to a business problem that is implemented top-down, without genuine commitment by the people who actually have to apply the solution (and change behaviors in doing so), is likely to end up a transient response leading to a return to the previous steady state.

So, in keeping with an operations research view of resolutions, I’ve been thinking about my resolutions with a particular focus on variables (what choices can I make), constraints (what are the limits on those choices) and objectives (what I am trying to accomplish).  It does no good to define objectives and go willy-nilly off in those directions without also defining the constraints that stop me from doing so.   But, of course, a creative re-definition or expansion of variables might let me find better solutions.

I have personal resolutions, and take inspiration from people around me who are able to transform themselves (yes, BB, I am talking about you!).  But I also have some professional resolutions.  So, here they are, and I hope they have been improved by an operations research view:

  1. Make time for research.  This might seem to be a funny resolution:  isn’t that a big part of what professors do?  Unfortunately, I have taken an administrative role, and there is a never-ending list of things to do.    Short term, it seems if I will be a better Associate Dean if I get on with the business of Associate Deaning, but long-term I know I will be a better Associate Dean if I keep active in research.  The decision model on time allocation has to be long term, not short term.
  2. Do what makes me happiest.  But where will the time come from?  I need to stop doing some things, and I have an idea of what those are.  I have been very fortunate in my career: I’ve been able to take part in the wide varieties of activities of a well-rounded academic career.  Not all of this gives me equal pleasure.  Some aspects (*cough* journals *cough*) keep me up at night and are not my comparative advantage.  So now is the time to stop doing some things so I can concentrate on what I like (and what I am comparatively good at).  While many of my decisions in my life can be made independently, time is a major linking constraint.
  3. Work harder at getting word out about operations research.  This has not been a great year for this blog with just 51 posts.  I don’t want to post just for the sake of posting, but I had lots of other thoughts that just never made it to typing.  Some appeared as tweets, but that is unsatisfying.  Tweets are ephemeral while blog entries continue to be useful long after their first appearance.  This has been a major part of my objective function, but I have been neglecting it.
  4. Truly embrace analytics and robustness.  While “business analytics” continues to be a hot term, I don’t think we as a field have truly internalized the effect of vast amounts of data in our operations research models.  There is still too much a divide between predictive analytics and prescriptive analytics.  Data miners don’t really think of how their predictions will be used, while operations researchers still limit themselves to aggregate point estimates of values that are best modeled as distributions over may, predictable single values.   Further, operations research models often create fragile solutions.  Any deviation from the assumptions of the models can result in terrible situations.  A flight-crew schedule is cheap to run until a snowstorm shuts an airport in Chicago and flights are cancelled country-wide due to cascading effects.  How can we as a field avoid this “curse of fragility”?  And how does this affect my own research?  Perhaps this direction will loosen some constraints I have seen  as I ponder the limits of my research agenda.
  5. Learn a new field.  While I have worked in a number of areas over the years, most of my recent work has been in sports scheduling.  I started in this are in the late 90s, and it seems time to find a new area.  New variables for my decision models!
OK, five resolutions seems enough.  And I am not sure I have really embraced an operations research approach:  I think more constraints are needed to help define what I can do, my objective is ill-defined, and even my set of variables is too self-limited.  But if I can make a dent in these five (along with the eight or so on my personal list) then I will certainly be able to declare 2012 to be a successful year!

Happy New Year, everyone, and I wish you all an optimal year.

This entry is part of the current INFORMS Blog Challenge.

Prostates and Probabilities

After a few years hiatus, I finally got back to seeing a doctor for an annual physical last week.  For a 51-year-old male with a fondness for beer, I am in pretty good shape.  Overweight (but weighing a bit less than six months ago), pretty good blood pressure (123/83), no cholesterol issues, all without the need for an drug regime.

Once you hit your mid-to-late 40s  (and if you are a male), doctors begin to obsess about your prostate.  There is a good reason for this:  prostate cancer is the second most common reason for cancer death among males (next to lung cancer).  So doctors try to figure out whether you have prostate cancer.

However, there is a downside to worrying about the prostate.  It turns out that lots of men  have prostate cancer, and most men will die of something else.  The cancer is often slow growing and localized, making it less of a worry.  Cancer treatment, on the other hand, is invasive and risky, causing not only death through the treatment (rare but not negligible) but various annoying issues such as impotence, incontinence, and other nasty “in—“s.   But if the cancer is fast growing, then it is necessary to find it as early as possible and aggressively treat it.

So doctors want to check for prostate cancer.  Since the prostate is near the surface, the doctor can feel the prostate, and my doctor did so (under the watchful gaze of a medical student following her and, as far as I know, a YouTube channel someplace).  When I say “near the surface”, I did not mention which surface:  if you are a man of a certain age, you know the surface involved.  The rest of you can google “prostate exam” and spend the rest of the day trying to get those images out of your mind.

Before she did the exam, we did have a conversation about another test:  PSA (Prostate Specific Antigen) testing.  This is a blood test that can determine the amount of a particular antigen in the blood.  High levels are associated with prostate cancer.  My doctor wanted to know if I desired the PSA test.

Well, as I was recovering from the traditional test (she declared that my prostate felt wonderful:  if it were a work of art, I own the Mona Lisa of prostates, at least by feel), I decided to focus on the decision tree for PSA testing.  And here I was let down by a lack of data.  For instance, if I have a positive PSA test, what is the probability of my having prostate cancer?  More importantly, what is the probability that I have the sort of fast growing cancer for which aggressive, timely treatment is needed?  That turns out to be quite a complicated question.  As the National Cancer Institutes of the NIH report, there is not any clear cutoff for this test:

PSA test results show the level of PSA detected in the blood. These results are usually reported as nanograms of PSA per milliliter (ng/mL) of blood. In the past, most doctors considered a PSA level below 4.0 ng/mL as normal. In one large study, however, prostate cancer was diagnosed in 15.2 percent of men with a PSA level at or below 4.0 ng/mL (2). Fifteen percent of these men, or approximately 2.3 percent overall, had high-grade cancers (2). In another study, 25 to 35 percent of men who had a PSA level between 4.1 and 9.9 ng/mL and who underwent a prostate biopsywere found to have prostate cancer, meaning that 65 to 75 percent of the remaining men did not have prostate cancer (3).

In short, even those with low PSA values have a pretty good chance of having cancer.  There is the rub between having a test “associated with” a cancer, and having a test to determine a cancer.  Statistical association is easy: the correlation might be very weak, but as long as it is provably above zero, the test is correlated with the disease.  Is the correlation high enough?  That depends on a host of things, including an individual’s view of the relative risks involved.  But this test is clearly not a “bright line” sort of test neatly dividing the (male) population into those with cancers that will kill them and those without such cancers.

In the days since my doctor’s appointment, there have been a slew of articles on PSA testing, due to the US Preventative Services Task Force moving towards declaring that PSA testing has no net benefit.  The Sunday New York Times Magazine has an article on prostate screening.  The article includes a wonderfully evocative illustration of the decision to be made:

David Newman, a director of clinical research at Mount Sinai School of Medicine in Manhattan, looks at it differently and offers a metaphor to illustrate the conundrum posed by P.S.A. screening.

“Imagine you are one of 100 men in a room,” he says. “Seventeen of you will be diagnosed with prostate cancer, and three are destined to die from it. But nobody knows which ones.” Now imagine there is a man wearing a white coat on the other side of the door. In his hand are 17 pills, one of which will save the life of one of the men with prostate cancer. “You’d probably want to invite him into the room to deliver the pill, wouldn’t you?” Newman says.

Statistics for the effects of P.S.A. testing are often represented this way — only in terms of possible benefit. But Newman says that to completely convey the P.S.A. screening story, you have to extend the metaphor. After handing out the pills, the man in the white coat randomly shoots one of the 17 men dead. Then he shoots 10 more in the groin, leaving them impotent or incontinent.

Newman pauses. “Now would you open that door?”

Is more information better?  To me, information matters only if it changes my actions.  Would a “positive” PSA test (whatever that means) lead me to different health-care decisions?  And is it really true that more information is always better?  Would my knowing that I, like many others, had cancerous prostate cells (without knowing if they will kill me at 54 or 104) really improve my life?

Perhaps in a few years, we’ll have a some advances.  Ideal, of course, would be a test that unmistakably can determine if a man has a prostate cancer that, untreated, will kill him.  Next best would be better, more individual models that would say, perhaps “A 53 year old male, with normal blood pressure and a fondness for beer, with a prostate shape that causes angels to sing, and a PSA value of 4.1 has an x% chance of having a prostate cancer that, untreated, will kill him with five years.”  Then I would have the data to make a truly informed decision.

This year, I opted against the PSA test, and everything I have read so far has made me more confident in my decision.  Of course, I did not necessarily opt out of PSA testing forever and ever:  I get to make the same decision next year, and the one after that, and the one after that….  But I will spend the time I save in not worrying about PSA testing by working out more at the gym (and maybe adding a bit of yoga to the regime).  That will, I think, do me much more good.

On the Shoulders of Giants

Yesterday I was messing around with The Mathematics Genealogy Project and I learned that Anna Nagurney, among others, is a not-so-distant cousin.  That inspired me to shoot off a couple of emails trying to trace my history farther back.

To recap, my advisors were Don Ratliff and John Bartholdi.  John was a student of Don, so Don is both my father and grandfather, a situation that would certainly raise eyebrows outside of academia.  Don’s advisor was Manny Bellmore who did a lot of fundamental work in the late 1960s and 70s on the traveling salesman problem and various other optimization problems.  Manny’s advisor was Frederick (Tom) Sparrow, who did extensive work in energy modeling and policy, among other things.  Bellmore also worked with George Nemhauser, but George was on leave in England when Manny graduated, so Sparrow was the advisor.  It is through Sparrow that I am related to Nagurney.

To continue earlier in history, I shot off an email to Tom, who is emeritus from Purdue.  Fortunately my email got through the spam filters (starting an email “Hello Great-Grandfather” does make it sound like a plea from a Nigerian prince), and he could tell me about his advisors.  He had two  The first was an economist named Kenneth Boulding.  This is a name I should know but do not.  He did some fundamental work in systems science and conflict analysis starting in the mid-1950s with some papers that are incredibly well cited.  When the wikipedia description begins with:

Kenneth Ewart Boulding (January 18, 1910 – March 18, 1993) was an economist, educator, peace activist, poet, religious mystic, devoted Quaker, systems scientist, and interdisciplinary philosopher

it is clear we are talking about someone unusually interesting.

Tom’s other advisor is, however, known to me (as it is to many in operations research):  Merrill Flood (1908-1991).  Flood was a founder of the field of operations research.  He worked on transportation problems in the 1930s and developed the “Northwest Corner” rule for finding a solution to such problems, before Dantzig developed a general method for optimizing these problems.  He also was an early researcher on the game-theory problem Prisoner’s Dilemma.  He was also an influential popularizer of the Traveling Salesman Problem.   He was the second President of TIMS, and he received the Kimball Medal for services to the field (a designation I have the honor to share with him).

Flood happens to be in the Mathematics Genealogy Project (though without listed advisees) and his advisor was Joseph Henry Maclagan Wedderburn (1882-1948), Scottish-born algebraist who taught at Princeton for most of his career.  Wedderburn’s advisor was George Chrystal (1851-1911),  whose advisor was James Clerk Maxwell (1831-1879), father of electromagnetic theory!  Checking out his wikipedia article leads to the immortal verse:

Gin a body meet a body
Flyin’ through the air.
Gin a body hit a body,
Will it fly? And where?

Going back from Maxwell, we get William Hopkins (1793-1866), who combined mathematics with geology.  I love the wikipedia entry on his private life:

Hopkins enjoyed music, poetry and landscape painting. He spent the end of his life in a lunatic asylum in Stoke Newington. He died there of chronic mania and exhaustion.

Perhaps not an unusual ending for mathematicians.

Back from there we get Adam Sedgwick (1785-1873), a founder of geology.  He had two advisors:  Thomas Jones (1756-1807) and John Dawson (1734–1820), a mathematician and surgeon.  Dawson leads to Edward Waring (1736-1798), a Lusasian Professor of Mathematics.

On the Jones side, we get two advisors: John Cranke (1746-1816) and Thomas Postlethwaite (1731-1798).  Fortunately Cranke was the student of Postlethwaite, so we don’t branch (making an already large lineage even bushier).  At this point we hit two Cambridge tutors:  Stephen Whisson (?-1783) and Walter Taylor (c1700-1743).  Taylor was trained by Robert Smith (1689-1768), known as Old Focus for his work in optics.  Smith leads to Roger Cotes (1682-1716), who worked closely with his advisor… Sir Isaac Newton!  That makes Sir Isaac my Great-Great-Great-Great-Great-Great-Great-Great-Great-Great-Great-Great-Great-Grandfather (academically speaking).

From Philosophiæ Naturalis Principia Mathematica to A Dynamical Theory of the Electromagnetic Field to trying to schedule 8 team sports leagues in a mere 15 generations. On the shoulders of giants indeed!

I suspect that if the system was completely filled in, we would all be descendants of Newton.  But I am walking a little taller today, and feeling a bit more pressure in my research, knowing of my illustrious ancestors.

Finding Love Optimally

Like many in operations research, my research interests often creep over into my everyday life. Since I work on scheduling issues, I get particularly concerned with everyday scheduling, to the consternation of my friends and family (“We should have left six minutes ago: transportation is now on the critical path!”). This was particularly true when I was a doctoral student when, by academic design, I was living and breathing operations research 24 hours a day.

I was a doctoral student from ages 22 to 27 (age will be relevant shortly), and like many in that age group, I was quite concerned with finding a partner with whom to spend the rest of my life. Having decided on certain parameters for such a partner (female, breathing, etc.), I began to think about how I should optimally find a wife. In one of my classes, it hit me that the problem has been studied: it is the Secretary Problem! I had a position to fill (secretary, wife, what’s the difference?), a series of applicants, and my goal was to pick the best applicant for the position.

Fortunately, there is quite a literature on the Secretary Problem (for a very nice summary of results, see this site, from which I also got the background to the graphic for this entry), and there are a number of surprising results. The most surprising is that it is possible to find the best secretary with any reasonable probability at all. The hard part is that each candidate is considered one at a time, and an immediate decision must be made to accept or reject the candidate. You can’t go back and say “You know, I think you are the cat’s meow after all”. This matched up with my empirical experience in dating. Further, at each step, you only know if the current candidate is the best of the ones you have seen: candidates do not come either with objective values or with certifications of perfection, again matching empirical observations. You can only compare them with what you have sampled.

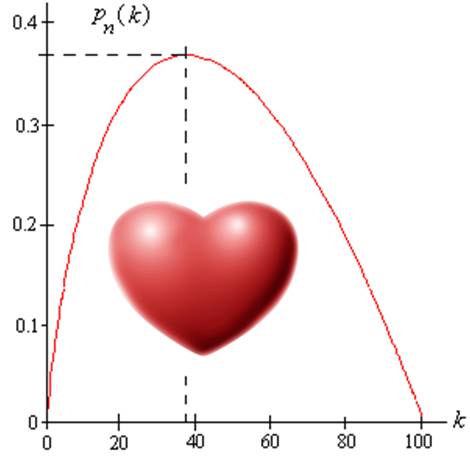
Despite these handicaps, if you know how many candidates there are, there is a simple rule to maximize the chance of finding the best mate: sample the first K candidates without selecting any of them, and then take the first subsequent candidate who is the best of all you have seen. K depends on N, the total number of candidates you will see. As N gets big, K moves toward 1/e times N, where e is 2.71…. So sample 36.9% of the candidates, then take the first candidate who is the best you have seen. This gives a 36.9% chance of ending up with Ms (in my case) Right.

One problem here: I didn’t know what N is. How many eligible women will I meet? Fortunately, the next class covered that topic. If you don’t know what N is but know that you will be doing this over a finite amount of time T, then it is OK to replace this with a time cutoff rule: simply take the first candidate after 36.9% of the time (technically, you use 36.9% of the cumulative distribution, but I assumed a uniform distribution of candidate arrivals). OK, I figured, people are generally useless at 40 (so I thought then: the 50-year-old-me would like to argue with that assumption), and start this matching process at about 18 (some seem to start earlier, but they may be playing a different game), so, taking 36.9% of the 22 year gap gives an age of 26.11. That was my age! By a great coincidence, operations research had taught me what to do at exactly the time I needed to do that.

Redoubling my efforts, I proceeded to sample the candidate pool (recognizing the odds were against me: there is still only a 36.9% chance of finding Ms Right) when lo and behold. I met Her: the woman who was better than every previous candidate. I didn’t know if she was Perfect (the assumptions of the model don’t allow me to determine that), but there was no doubt that she met the qualifications for this step of the algorithm. So I proposed.

And she turned me down.

And that is when I realized why it is called the Secretary Problem, and not the Fiancee Problem (though Merrill Flood proposed the problem under that name). Secretaries have applied for a job and, presumably, will take the job if offered. Potential mates, on the other hand, are also trying to determine their best match through their own Secretary Problem. In order for Ms Right to choose me, I had to be Mr. Right to her! And then things get much more complicated. What if I was meeting women in their sampling phase? It did seem that some people were very enthusiastic about having long sampling phases, and none of them would be accepting me, no matter how good a match they would be for me. And even the cutoff of 36.9% looks wrong in this case. In order to have a hope of matching up at all in this “Dual Secretary Problem”, it looked like I should have had a much earlier cutoff, and in fact, it seemed unlikely there was a good rule at all!

I was chagrined that operations research did not help me solve my matching problem. I had made one of the big mistakes of practical operations research: I did not carefully examine the assumptions of my model to determine applicability.

Downcast, I graduated with my doctorate, resolving to marry myself to integer programming. I embarked on a postdoc to Germany.

There, I walked into a bar, fell in love with a beautiful woman, moved in together three weeks later, invited her to live in the United States “for a while”, married her six years after that, and had a beautiful son with her six years ago. I am not sure what optimization model led me down that path, but I think I am very happy with the result.

Some details of this story have been changed to protect me from even more embarrassment. This post is part of the February INFORMS Blog Challenge.

Postdocs and Special Year at the IMA

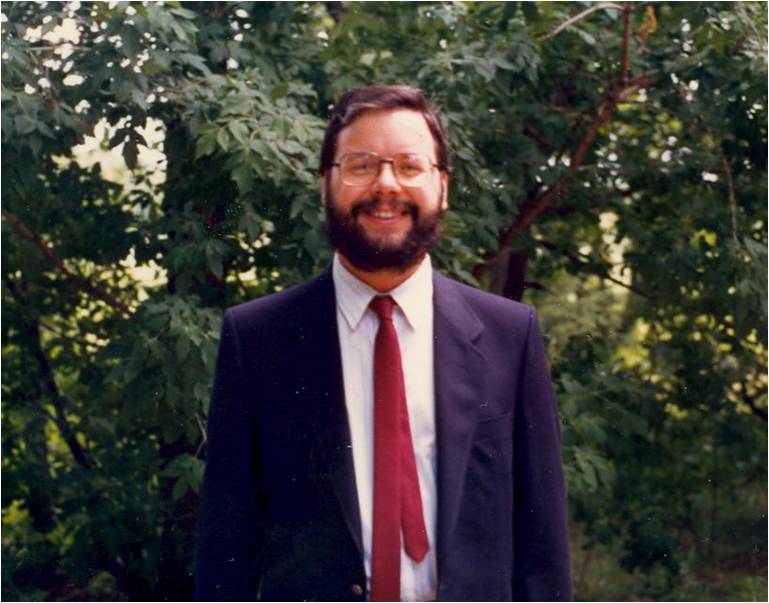
In 1987-88, I spent a great year in Minneapolis as a postdoc at the Institute for Mathematics and its Applications (and this picture of me comes from that time). Every year at the IMA has a special theme, and the theme my year was “Applied Combinatorics”. There were about a dozen of us postdocs that year: 11 combinatorialists, and me, the OR guy, who I guess satisfied the Applied in year’s title. It was a fantastic year. The other combinatorialists were scary-smart and doing amazing things. One of the postdocs was Bernd Sturmfels who was working on Grobner Bases at the time and has gone on to an amazing career in applying algebraic methods in optimization, statistics, and other fields. I look at his list of 190 papers and 15 books and realize what a slacker I am!

The year at the IMA was important for my career. It gave me the chance to finish my dissertation papers and move on to new research. I met a great group of people and learned about some aspects of an academic career without being saddled with teaching or administrative duties.

Depending on the year, the IMA may be more or less interesting to operations researchers. Next year (2011-12) looks to be a good one. It is on “The Mathematics of Information”. There are a couple versions of the description of the year. I like the one on the Geomblog:

During the academic year 2011-2012, the annual program at the Institute for Mathematics and its Applications (IMA) at the University of Minnesota will be in the Mathematics of Information. Information, broadly defined, plays an ever increasingly large role in our scientific and technological endeavors, as well as our daily lives. Collectively, we search the web over billions of times per day, we keep our medical records in digital repositories, we share videos and photos over the web, and we listen to music on MP3 players. Our ability to collect, store, and generate vast quantities of data far outstrips our ability to analyze, process, and understand these data. Many scientific, engineering, and medical applications depend on our ability to handle enormous amounts of complex information. Network engineering involves massive datasets at high speeds, medical imaging generates large data with intricate geometric relationships, and astronomical observations include data at different wavelengths or spectral bands. Our current technology and scientific tools for information lag far behind our ability to collect enormous amounts of data, our need to analyze that data as efficiently as possible, and, finally, our ability to use that analysis to make sound, timely decisions.

“Sound, timely decisions” is what operations research is all about.

The postdoc deadline was January 7, 2011 but applications will be considered until February 4, 2011. So get a move on if you are interested!

There is also funding for more established researchers to spend time at the IMA. It is a great way to get started in new research directions and to rub off the administrative barnacles that attach if you stay at one place too long.